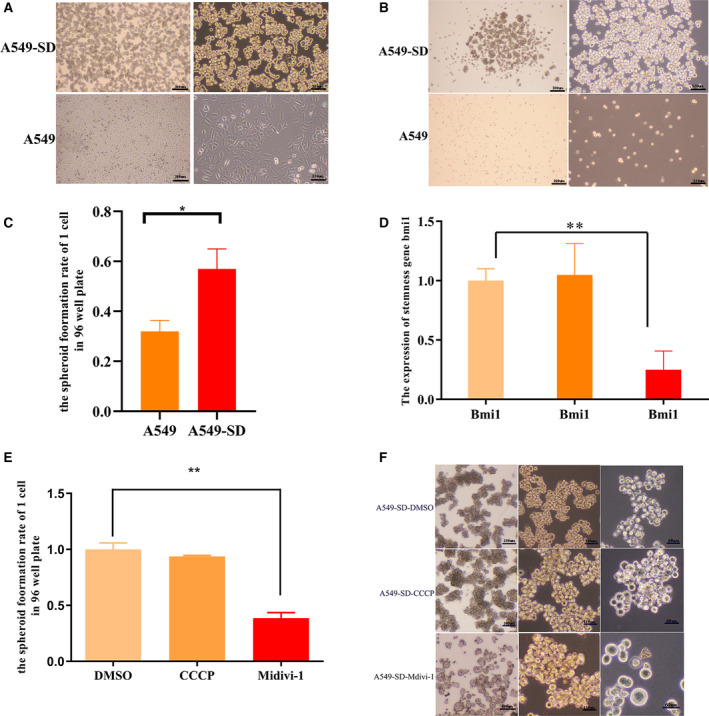
Fig. 1.

Mitophagy promotes the stemness of CSCs. (A) Morphological comparison of A549 cells and A549‐SD cells. The scale bars of the 4× and 10× images are 300 µm and 120 µm. (B) The spheroid formation ability of 1000 cells of A549 and A549‐SD cells in a six‐well plate. The scale bars of the 4× and 10× images are 300 µm and 120 µm. (C) The spheroid formation rate of a single cell in 96‐well plate of A549 and A549‐SD cells. (D) mRNA expression of stemness gene bmi1 in DMSO, CCCP and Mdivi‐1 treated cells. (E) The spheroid formation rate of a single cell in a 96‐well plate of DMSO, CCCP and Mdivi‐1 treated cells. (F) The spheroid formation ability of 1000 cells of DMSO, CCCP and Mdivi‐1 treated cells in a six‐well plate. The scale bars of 4×, 10× and 20× images are 300, 120 and 60 µm, respectively. *P < 0.05, **P < 0.01; one‐way analysis of variance; the error bars indicate the SD; the number of biologically‐independent replicates is 3.
