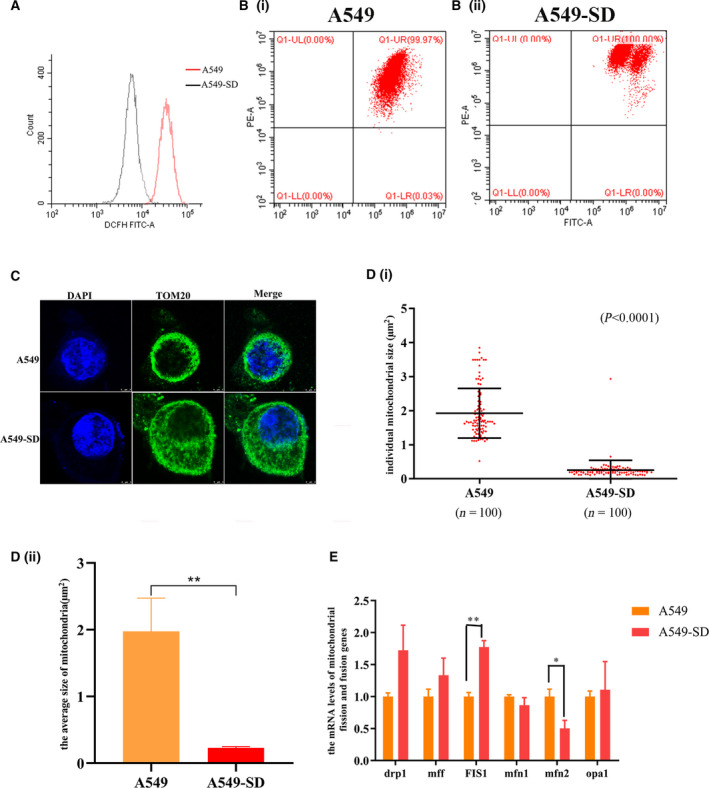
Fig. 2.

Differences between mitochondria in A459 parental and A549‐SD stem cells. (A) The ROS levels of A549 and A549‐SD cells. (Bi) The mitochondrial membrane potential of A549 cells. (Bii) The mitochondrial membrane potential of A549‐SD cells. (C) Distribution and size of mitochondrial in A549 and A549‐SD cells. Mitochondrial protein TOMM20 was used as a marker of mitochondrial. Scale bar = 3 µm. (Di) Sizes of 100 single mitochondria in A549 and A549‐SD cells. (Dii) The average size of 100 mitochondria in A549 and A549‐SD cells. (E) Expression of mitochondrial fission and fusion‐related genes in A549 and A549‐SD cells. *P < 0.05, **P < 0.01; one‐way analysis of variance; the error bars indicate the SD; the number of biologically‐independent replicates is 3.
