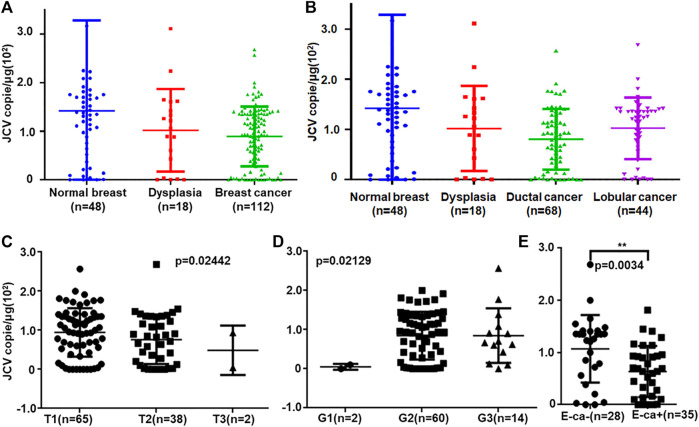
FIGURE 2.
JCV T antigen loads in breast cancers. T antigen copies were measured and calculated in normal, dysplasia, and cancer tissues by real-time PCR (A). The copies were analyzed between ductal and lobular cancers (B). They were also compared with T staging (C), G grading (D), and E-cadherin expression (E). E-cad, E-cadherin expression.

