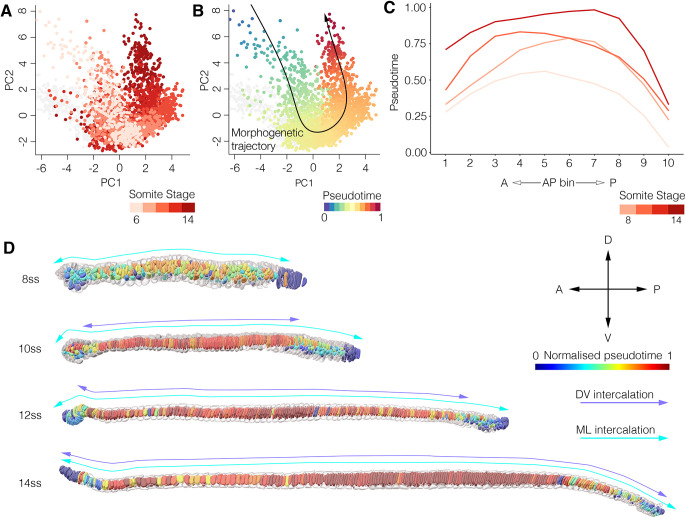
Fig. 4.
Temporal variation is spatially organised in bi-directional gradients. (A) All central layer notochord cells projected into morphospace, colour-coded for somite stage. (B) Central notochord cells ordered across an inferred pseudotemporal axis, guided by prior information on temporal transitions. (C) Mean pseudotemporal distance for cells in 10 evenly sized bins of the AP axis, in embryos between 8 ss and 14 ss. (D) Colour-coding of the central notochord layer by pseudotemporal distance, aligned with the progression of ML and DV intercalation events inferred from transitions in cell topology. Progress of ML and DV intercalation marked by cyan and purple bi-directional arrows. Representative of n=3 notochords/stage, n=2666 central layer cells.

