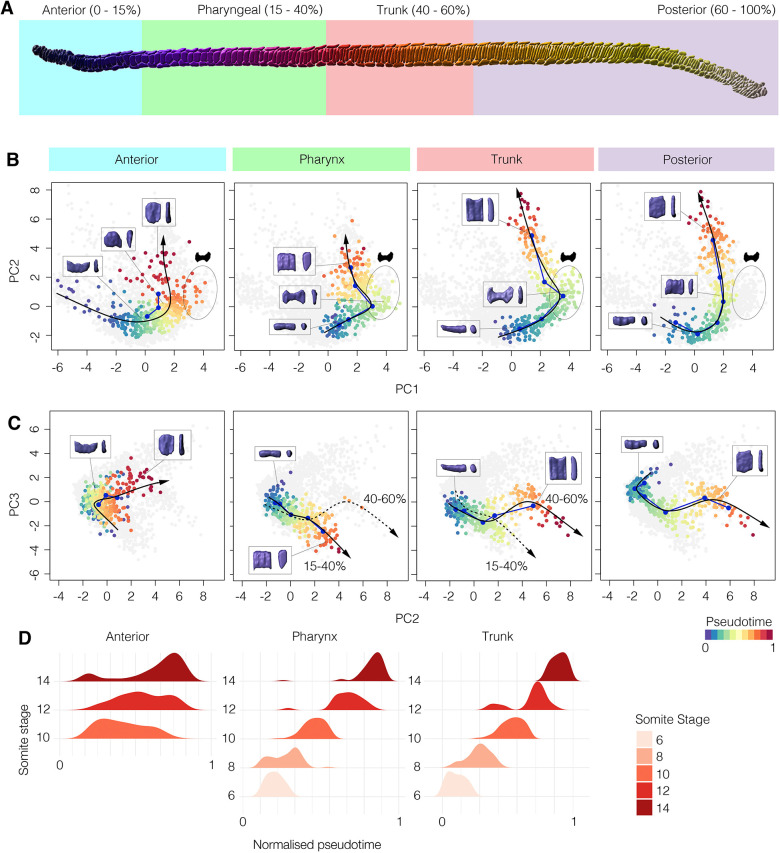
Fig. 5.
Variation in cell shape trajectories across the AP axis. (A) Segmented 14 ss notochord showing sampled regions on the AP axis for trajectory comparison. (B) Cells from each region defined in A projected on PC1 and PC2, with a segmented line connecting point cloud centres for each stage (blue) and an inferred pseudotemporal trajectory (black). For the posterior trajectory, six bins of AP length at 14 ss are used instead of somite stage. Pseudotemporal position is colour coded. (C) Projections of the same cells as B, against PC2 and PC3. For the 15-40% and 40-60% levels, both trajectories are highlighted for comparison. Representative cells are shown in insets; anterior (left) and lateral (right) views. (D) Density plots showing the frequency of cells across pseudotime for each somite stage in the anterior, pharyngeal and trunk regions. Anterior, n=396; pharynx, n=360; trunk, n=344; posterior, n=408.

