Figure 1.
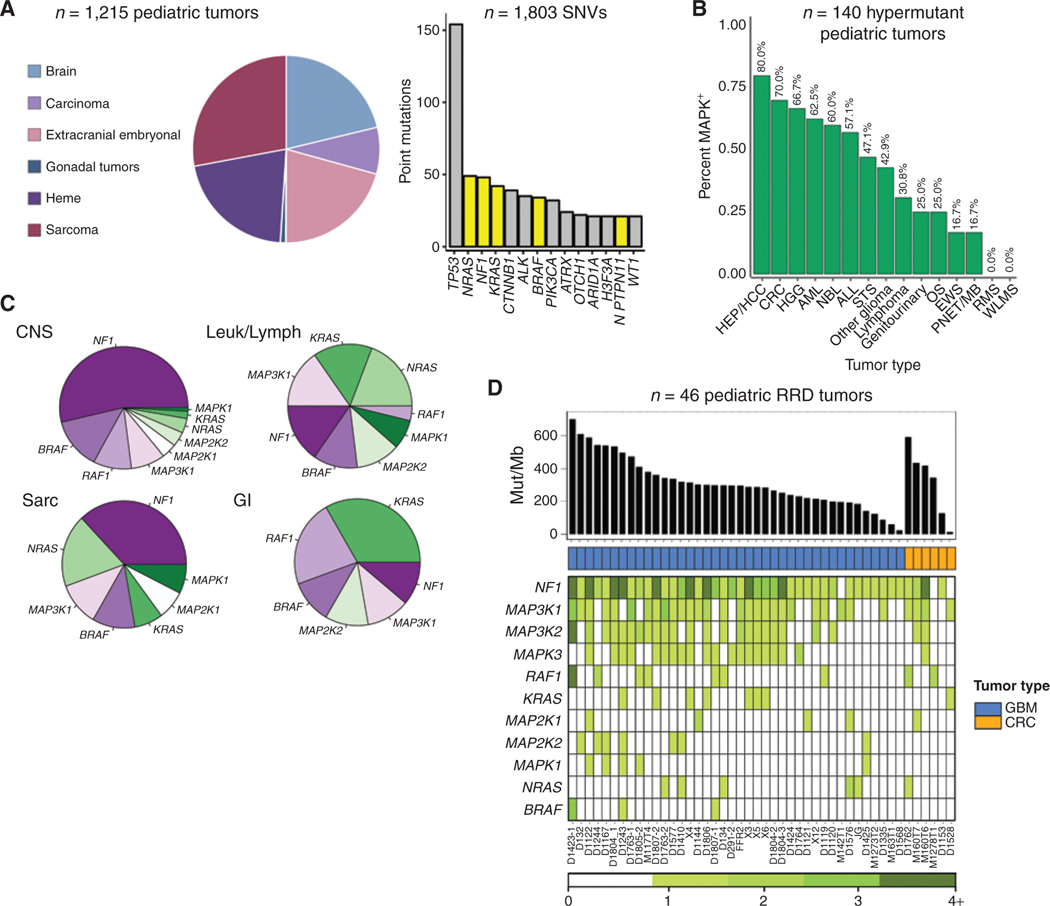
Prevalence of RAS/MAPK genetic events across 1,215 pediatric cancers. A, Pie graph indicates the tissue of origin of 1,215 pediatric cancers. 1,803 SNVs were detected across the entire cohort; RAS/MAPK-activating events are indicated in yellow. B, Prevalence of RAS/MAPK mutations in hypermutant pediatric tumors, stratified by tumor type. HEP/HCC, hepatocellular carcinoma; CRC, colorectal cancer; HGG, high grade glioma; AML, acute myeloid leukemia; NBL, neuroblastoma; ALL, acute lymphocytic leukemia; STS, soft tissue sarcoma; OS, osteosarcoma; EWS, Ewing sarcoma; PNET/MB, primitive neuro-ectodermal tumors/medulloblastoma; RMS, rhabdomyosarcoma; WLMS, Wilms tumor. C, Pie graphs demonstrating the distribution of the 11 most commonly mutated RAS/MAPK genes across different tissues of origin. D, Exome sequencing of 46 glioblastomas (GBM) and colorectal cancers (CRC) from patients with germline mutations in MMR and POLE. Top, tumor mutation burden in mutations/mb; middle, tumor type and number of nonsynonymous, protein-coding events in 11 commonly mutated RAS/MAPK genes.

