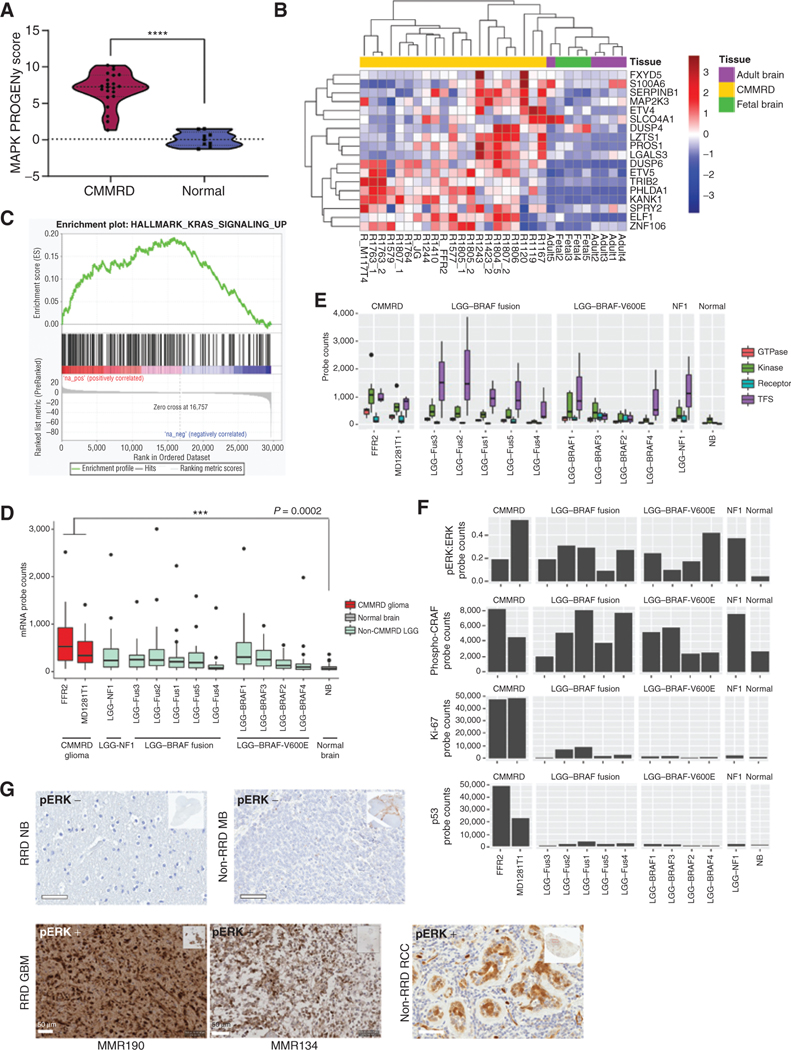
Figure 3.
Assessment of RAS/MAPK pathway activation in hypermutant RRD gliomas. A, Violin plot of RNA-seq–derived MAPK pathway PROGENy signature scores of CMMRD GBMs (n = 21) compared with normal fetal (n = 4) and adult (n = 5) brains (P < 0.0001; Welch t test). Lines indicate median and quartile values. B, Unsupervised clustering of all samples in A based on expression of an 18-gene RAS transcriptional output signature. C, GSEA enrichment plot for genes upregulated by KRAS activation in CMMRD GBM vs. normal brain samples in A and B. NES is reported (FDR = 0). D, NanoString counts of single mRNA molecules in 20 RAS/MAPK pathway–related probes, including EGFR, BRAF, KRAS, MAP3K1, FOS, and JUN, in CMMRD GBM compared with tissue-matched BRAFV600E mutant low-grade gliomas. E, NanoString counts of single mRNA molecules in 20 RAS/MAPK pathway–related probes, stratified by protein-type. Transcription factor targets of the RAS/MAPK pathway were the most upregulated. F, NanoString counts of single protein molecules involved in RAS/MAPK pathway activation, including phospho-ERK and phospho-CRAF. Ki-67 protein levels are shown to highlight the distinguishing growth characteristics of LGG versus GBM. For box plots D–E, median and quartile values are depicted. G, Positive IHC staining for phospho-ERK (pERK) on two representative CMMRD brain tumors harboring several RAS/MAPK pathway alterations (bottom left; MMR190 and MMR134), compared with a CMMRD normal postmortem brain sample and non-RRD pediatric medulloblastoma demonstrating negative staining (top), and a human renal cell carcinoma (RCC) sample demonstrating nuclear and cytoplasmic staining of phospho-ERK in tubular epithelial structures surrounded by negatively staining lymphocytes (bottom right). Scale bars, 50 μm. ****, P < 0.0001.

