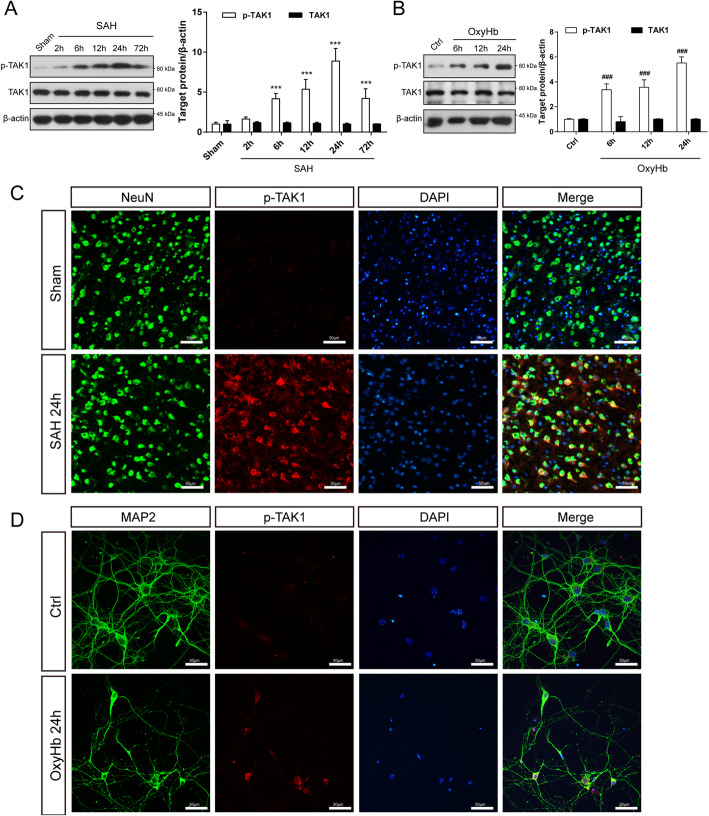
Fig. 1.
Temporal expression of TAK1 in the ipsilateral cortex following SAH. a Western blot showing p-TAK1 and TAK1 expression at 2 h, 6 h, 12 h, 24 h, and 72 h following SAH onset (n = 5 per group). b Western blot assay for the expression of p-TAK1 and TAK1 in OxyHb-exposed neurons (n = 5 per group). c Co-staining of p-TAK1 (red) and NeuN (green) demonstrated that p-TAK1 was upregulated in neurons 24 h after SAH (n = 2 per group). d Representative immunofluorescence staining images of p-TAK1 in control and OxyHb-exposed groups (n = 5 per group). Data are expressed as mean ± SD. ***P < 0.001 vs Sham group, ###P < 0.001 vs Control group. Scale bar: 50 μm

