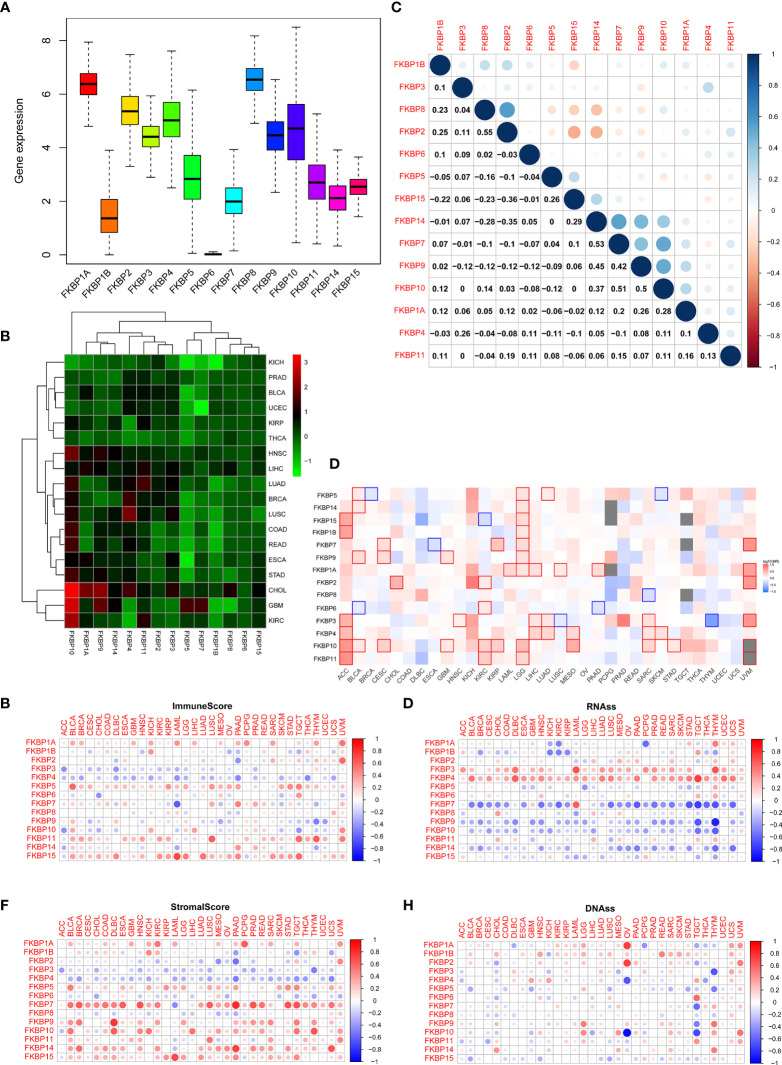
Figure 1.
Pan-cancer analysis of the FKBP gene family. (A) The average expression level of the FKBP gene family among 33 tumor types in the TCGA database. (B) Differential expression analysis of the FKBP gene family in different tumor types. Red: upregulate. Green: downregulate. (C) Correlation analysis of the FKBP gene family by using Spearman correlation coefficient. (D) Survival analysis of the FKBP gene family in different tumor types. Red: positive correlation. Blue: negative correlation (KIRC: Kidney Renal Clear Cell Carcinoma). (E, F) The correlation of the FKBP gene family and tumor microenvironment. Red: positive correlation. Blue: negative correlation. (G, H) The correlation of the FKBP gene family and stemness indices. Red: positive correlation. Blue: negative correlation.

