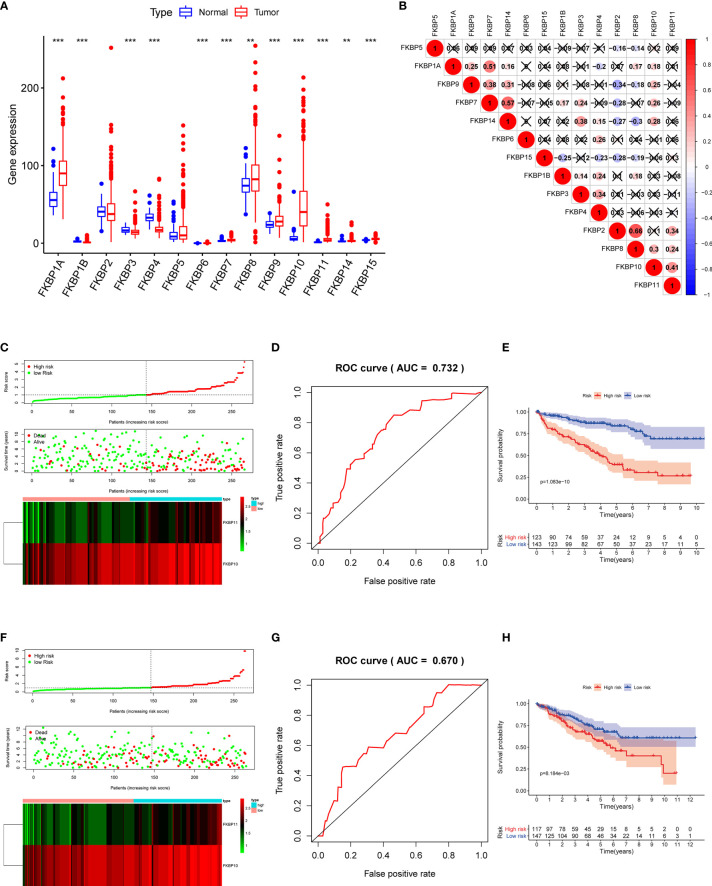
Figure 2.
Expression of FKBP genes and risk score model construction based on the TCGA database with ccRCC patients. (A) Expression of FKBP genes between ccRCC tissues and normal kidney tissues based on the TCGA database. (B) Correlation analysis of the FKBP gene family in ccRCC by using Spearman correlation coefficient. (C) Risk score, expression heat map, and survival status in the training group. (D) ROC curves for forecasting OS in the training group. (E) Survival curve for low- and high-risk subgroups in the training group. (F–H) Similar analysis in the test group. *P < 0.05 **P <0.01 ***P < 0.001.

