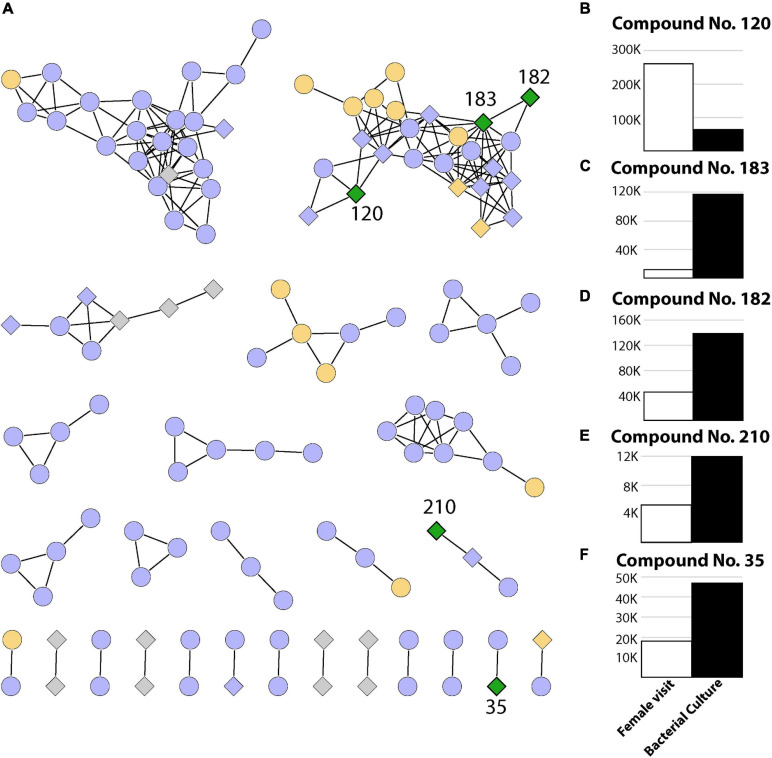
FIGURE 3.
Summary of 239 metabolites identified in this study. (A) Networks containing two or more metabolites (nodes) connected by edges when a minimum number of matching fragments is present (see section “Materials and Methods”). The coloring represents metabolites identified in experiments where only the female visited (T2, green), where the female visited and/or eggs were manually placed (T2 and/or T3, orange), where metabolites were present in the control sample and/or T3 and/or T2 (purple), as well as metabolites detected only in bacterial cultures (gray). Diamonds represent bacterial metabolites, while circles represent metabolites not present in bacterial samples. (B–F) Relative abundance (area under the curve from mass spectrometry) for compounds present in breeding site experiments where the female visited (T2) and also present in bacterial extracts (green diamonds).

