
6.
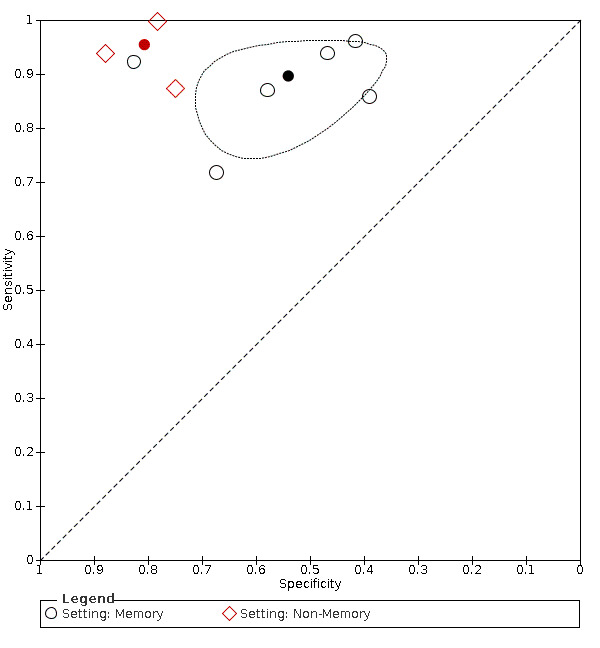
Summary ROC Plot of pooled IQCODE data at a 3.3 threshold (or nearest value), with setting as covariate. The dark point is a summary point, the broken line represents 95% confidence region
Official websites use .gov
A
.gov website belongs to an official
government organization in the United States.
Secure .gov websites use HTTPS
A lock (
) or https:// means you've safely
connected to the .gov website. Share sensitive
information only on official, secure websites.
Summary ROC Plot of pooled IQCODE data at a 3.3 threshold (or nearest value), with setting as covariate. The dark point is a summary point, the broken line represents 95% confidence region