6.

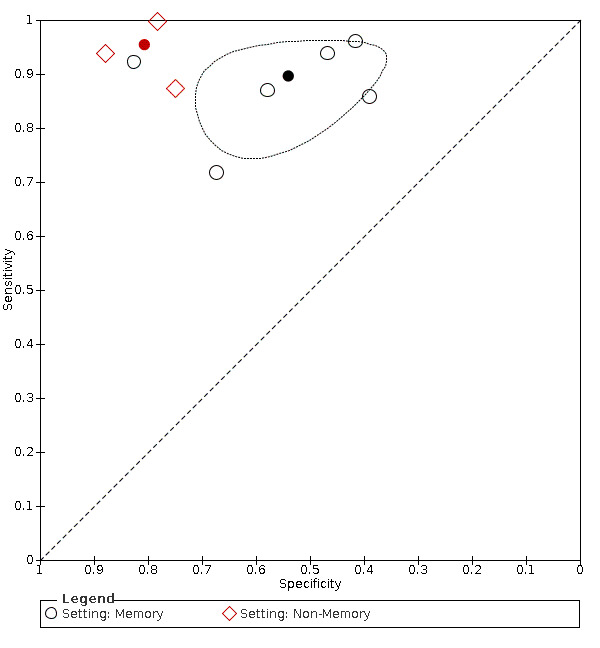
Summary ROC Plot of pooled IQCODE data at a 3.3 threshold (or nearest value), with setting as covariate. The dark point is a summary point, the broken line represents 95% confidence region

Summary ROC Plot of pooled IQCODE data at a 3.3 threshold (or nearest value), with setting as covariate. The dark point is a summary point, the broken line represents 95% confidence region