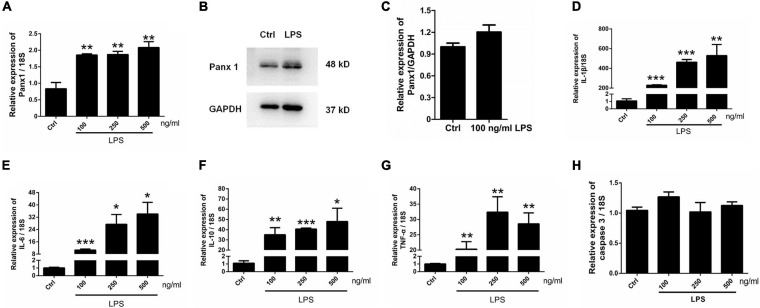
FIGURE 4.
Panx 1 and inflammatory cytokine expression in LPS-treated astrocytes. mRNA expression of Panx 1 (A) and the selected inflammatory cytokine IL-1β (D), IL-6 (E), IL-10 (F), TNF-α (G) and caspase 3 (H) were measured by qPCR assay. Primary cultured astrocytes were treated with LPS at different doses (100, 250, and 500 ng/ml) for 24 h. The levels were displayed as percentage of the control (the same volume of DMSO). The data were normalized to 18S mRNA levels. Western blot analysis of Panx 1 expression (B,C) after treatment with 100 ng/ml LPS. Protein levels were quantified and normalized to GAPDH levels, n = 3. All data are mean ± SEM. Statistical comparison for (A,D–H) were performed using one-way ANOVA, following by Newman–Keuls Multiple Comparison Test, and for (C) using Student’s t-test. *p < 0.05, **p < 0.01, ***p < 0.001 compared with the control group. Student’s t-test.

