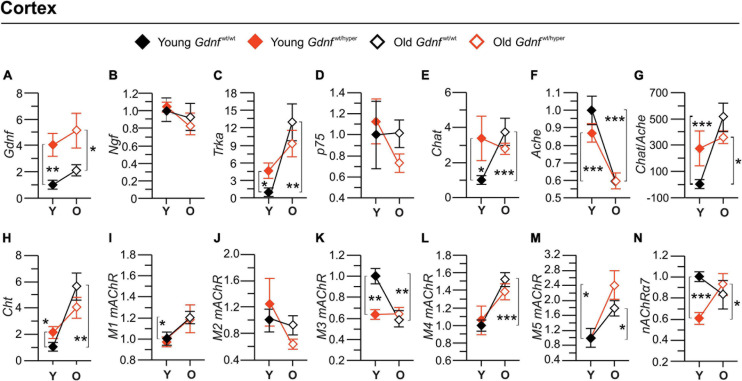
FIGURE 3.
Gene expression of the main cholinergic genes in the cortex. Graphs (A–F,H–N) show the fold-changes in the gene expressions relative to the corresponding gene expression level in the cortex of the young Gdnfwt/wt mice. The gene expressions were measured by quantitative PCR. Graph (G) shows percent changes in a Cholinergic index calculated based on the ratio between the gene expressions of Chat to Ache. n = 6 (young Gdnfwt/wt), n = 5 (old Gdnfwt/wt), n = 7 (young Gdnfwt/hyper), n = 6 (old Gdnfwt/hyper). Data are presented as mean fold changes ± SEM. *p < 0.05; **p < 0.01; ***p < 0.001. Ache, acetylcholinesterase; Chat, choline acetyltransferase; Cht, choline transporter; Gdnf, glial cell line-derived neurotrophic factor; M1 mAChR, m1 muscarinic ACh receptor; M2, m2 muscarinic ACh receptor; M3 mAChR, m3 muscarinic ACh receptor; M4, m4 muscarinic ACh receptor; M5, m5 muscarinic ACh receptor; p75, p75 neurotrophin receptor; α7-nAChR, alpha 7 nicotinic ACh receptor; Ngf, nerve growth factor; O, old; Trka, tropomyosin receptor kinase A; Y, young.

