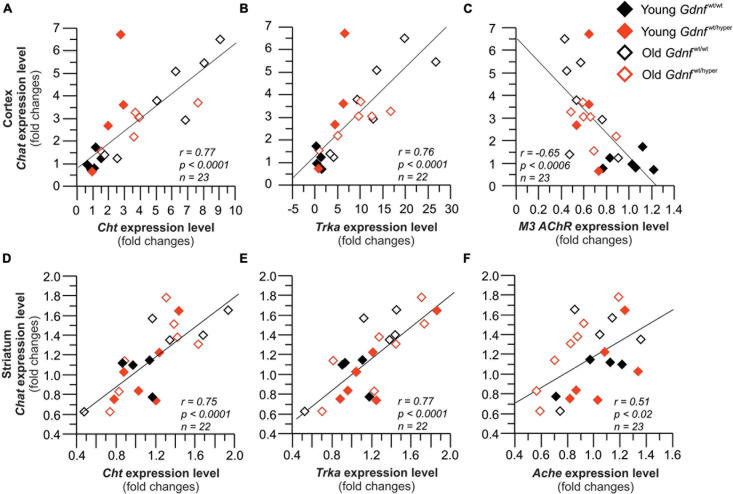
FIGURE 5.
Gene expression of the key cholinergic enzyme, Chat strongly correlates with the expression of the related genes. Graphs (A–C) show correlations in the cortex, and (D–F) show the correlations in the striatum. Cortex: n = 6 (young Gdnfwt/wt), n = 5 (old Gdnfwt/wt), n = 7 (young Gdnfwt/hyper), n = 6 (old Gdnfwt/hyper). Striatum: n = 5 (young Gdnfwt/wt), n = 6 (old Gdnfwt/wt), n = 6 (young Gdnfwt/hyper), n = 7 (old Gdnfwt/hyper). Ache, acetylcholinesterase; Chat, choline acetyltransferase; Cht, choline transporter; M3 mAChR, m3 muscarinic ACh receptor 3; Trka, tropomyosin receptor kinase A.

