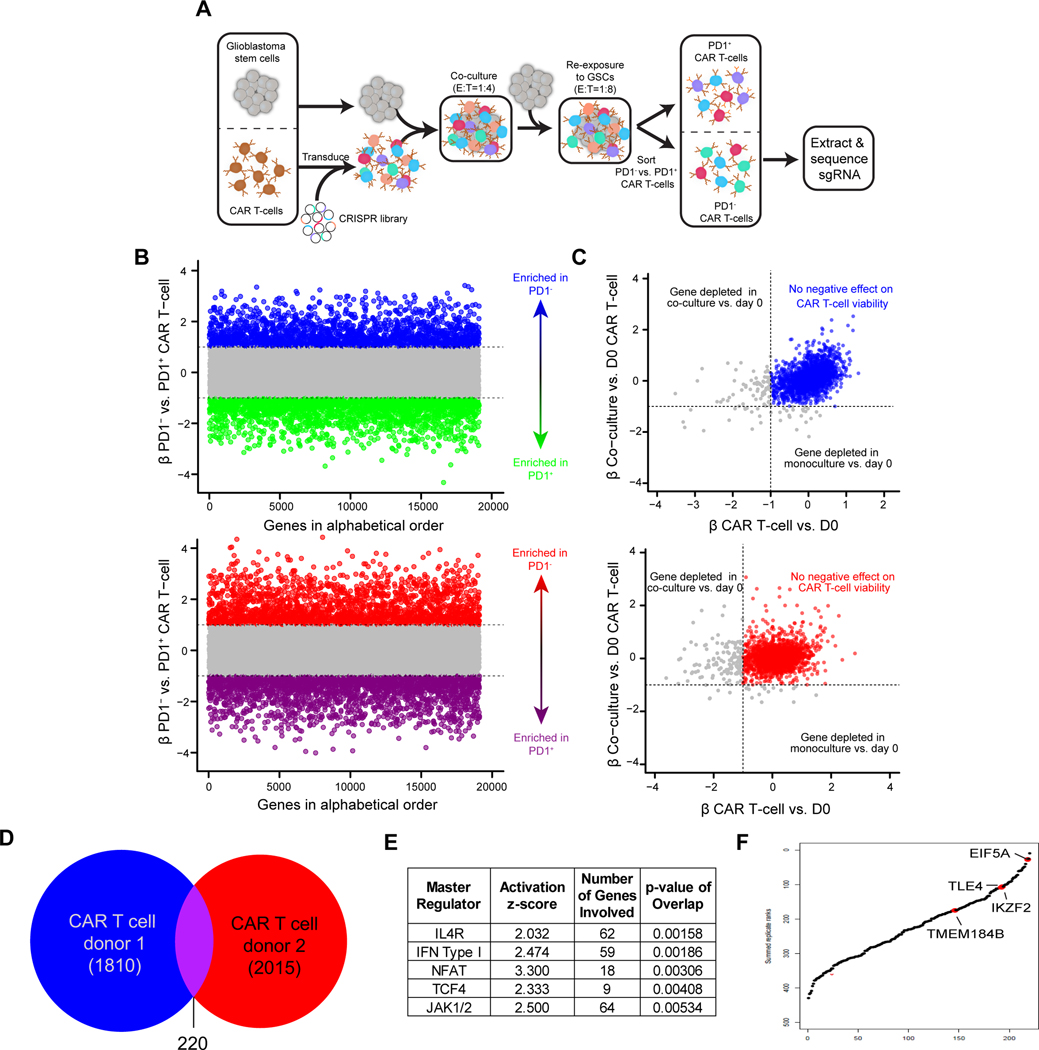
Figure 1. CRISPR-Cas9 screen in CAR T cells co-cultured with GSCs.
A, Overview of screen design. CAR T-cells were transduced with a whole-genome CRISPR-Cas9 library and co-cultured with GSCs, followed by a GSC rechallenge after 48 hours. At the conclusion of the screen (24 hours after the rechallenge), CAR T-cells were sorted for PD1 positivity and PD1+ or PD1− CAR T-cells were sequenced separately to identify enriched and depleted guides. B, Screen results in two replicates of independent donors with genes ordered alphabetically on the x-axis. The MAGECK β-value for each gene comparing PD1− vs. PD1+ is plotted on the y-axis. Genes enriched in PD1− cells at a β-value >1 are in blue or red and genes with a β-value of <−1 (enriched in PD1+ cells) are in green or purple. C, Plot of hits from (b) to exclude genes that are depleted following co-culture of CAR T-cells with GSCs (β-value <−1 on the y-axis) or in monoculture (β-value <−1 on the x-axis). Genes in blue or red are not depleted in either condition. D, Venn diagram illustrating common hits for depleted genes in two distinct T cell donors. E, Ingenuity Pathway Analysis of master regulators (top 5 based on p-values) of 220 overlapping genes in two T cell donors. F, Common hits ranked by β-value in a combined model for PD1− vs. PD1+ CAR T-cells. Labeled hits were selected for validation.

