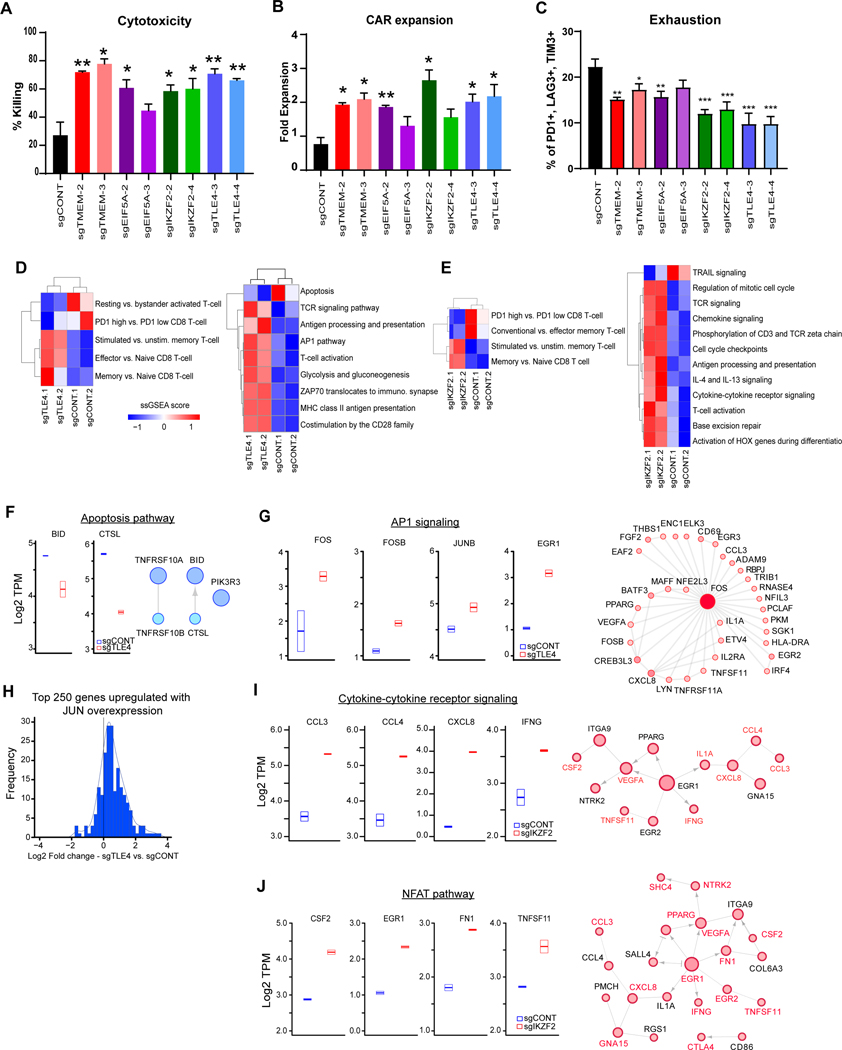
Figure 2. Targets on CAR T cells improves effector potency and alter transcriptional profiles.
A, Killing of CAR T cells with TLE4-, IKZF2-, TMEM184B- or EIF5A-KO against co-cultured GSCs (E:T=1:40, 48 hours). B, Expansion of CAR T cells with different knockouts in co-culture with GSCs (E:T=1:40, 48 hours). C, CAR T cells with targeted KOs of specific genes were co-cultured with PBT030–2 cells (E:T=1:4) for 48 hours, and re-challenged with tumor cells against (E:T=1:8) for 24 hours, and then analyzed for the expression of exhaustion markers. (A,B,C) *p<0.05, **p<0.01, ***p<0.001 compared to CAR T cells transduced with non-targeting sgRNA (black) using unpaired Student’s t tests. D and E, Unsupervised clustering of ssGSEA scores comparing TLE4-KO (C) or IKZF2-KO (D) vs. sgCONT CAR T cells for the signatures of selected T cell populations (left) or immune and functional pathways (right). F, Left: Boxplot of genes involved in apoptotic signaling from RNA-sequencing data in sgCONT (blue) vs. sgTLE4 (red). Right: Reactome network of genes downregulated following TLE4 knockout that are involved in apoptotic signaling. G, Left: Boxplot of genes involved in AP1 signaling from RNA-sequencing data in control (blue) vs. TLE4KO (red) cells. Right: Reactome network of genes upregulated with TLE4 knockout that are linked to FOS. Increasing node size and fill hue are proportional to node degree. H, Histogram of log2 fold change of gene expression (comparing TLE4KO vs. control) for 250 genes previously shown to be upregulated with JUN overexpression. I, Left: Boxplot of genes involved in cytokine receptor signaling from RNA-sequencing data in control (blue) vs. IKZF2KO (red) cells. Right: Reactome network of genes upregulated with IKZF2-KO that are linked to a gene in the cytokine receptor signaling pathway (labeled in red). Increasing node size and fill hue are proportional to node degree. J, Left: Boxplot of genes in the NFAT pathways from RNA-sequencing data in control (blue) vs. IKZF2KO (red) cells. Right: Reactome network of genes upregulated with IKZF2-KO that are linked to upregulated genes in the NFAT pathway (labeled in red).

