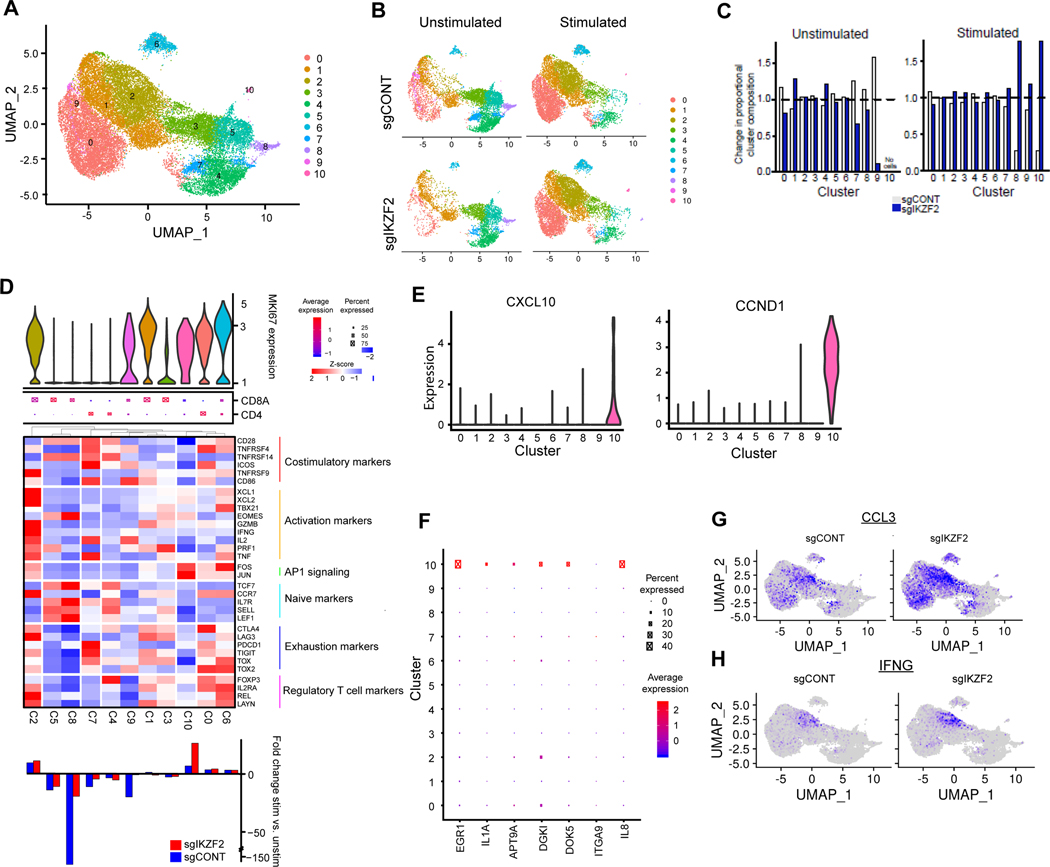
Figure 4. IKZF2 regulates CAR T cell subpopulations.
A, UMAP projection of single cell RNA sequencing of control and IKZF2KO CAR T-cells both before and after stimulation with GSCs. Top: Cluster assignments for the overall population. B, Cluster composition of unstimulated vs. unstimulated control or IKZF2KO cell populations. C, Population distribution of control and IKZF2KO CAR T cells before and after stimulation. D, Characterization of clusters based upon cell proliferation. Top: Violin plot of MKI67 expression. Middle: Dot plot of CD4 vs. CD8A expression wherein larger dots indicate a higher proportion of cells with expression and red vs. blue fill indicates higher expression. Heatmap: Scaled expression of T cell markers including costimulatory, activation, naive, exhaustion and regulatory T cell markers as well as AP1 signaling. Bottom: Proportion of cells in each cluster under stimulated vs. unstimulated conditions in sgCONT (blue) or sgIKZF2 (red) populations. Positive values indicate increase in cluster occupancy following stimulation. E, Expression of CXCL10 and CCND1 across clusters (violin plot). F, Expression of top upregulated genes in bulk RNA-seq for sgIKZF2 vs. sgCONT across single cell clusters. G and H, Expression of IFNG(G) and CCL3(H) in sgCONT or sgIKZF2 CAR T-cells superimposed on the UMAP projection.

