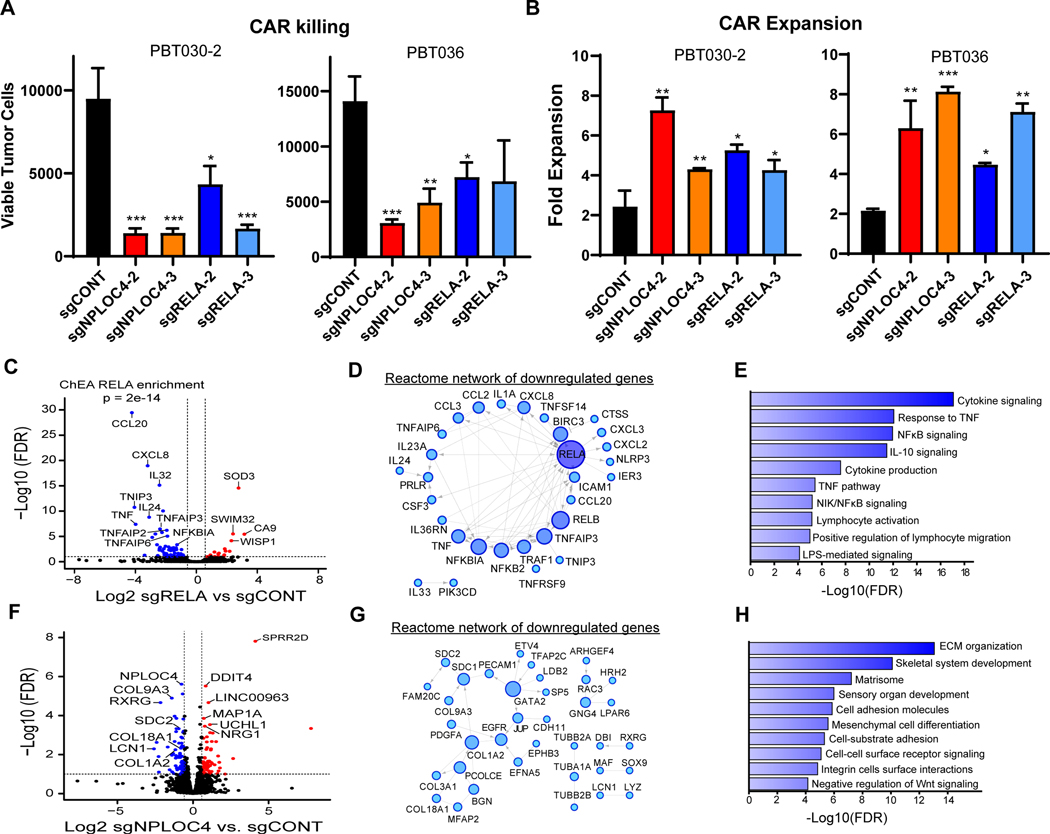
Figure 6. RELA or NPLOC4 disruption improves CAR T cell killing of GSCs.
A, CAR T cell killing of GSCs (E:T=1:40, 48 hours) with CRISPR-mediated knockout of RELA or NPLOC4. B, CAR T cell expansion in co-culture with GSCs (E:T=1:40, 48 hours) with CRISPR-mediated knockout of RELA or NPLOC4. (a, b) *p<0.05, **p<0.01, ***p<0.001 compared to GSCs transduced with non-targeting sgRNA (black) using unpaired Student’s t tests. C, RNA-sequencing of GSCs following RELA knockout plotted as –log10 FDR (y-axis) vs. log2 fold change of RELA knockout vs. control (x-axis). Blue or red points are genes with <−1.5- or >1.5-fold change, respectively at an FDR of <0.05. D, Reactome network of genes downregulated following RELA knockout. Only genes linked in the Reactome database to at least one other gene are shown. Node size and color saturation are proportional to node degree. Activating interactions are indicated by arrowheads, while dotted lines indicate predicted interactions. E, Pathway enrichment of genes in the Reactome network of downregulated genes in (c). F, RNA-sequencing of GSCs following NPLOC4 knockout plotted as –log10 FDR (y-axis) vs. log2 fold change of NPLOC4 knockout vs. control (x-axis). Blue or red points are genes with <−1.5- or >1.5-fold change, respectively at an FDR of <0.05. G, Reactome network of genes downregulated following NPLOC4 knockout. H, Pathway enrichment of genes in the Reactome network of downregulated genes in (F).

