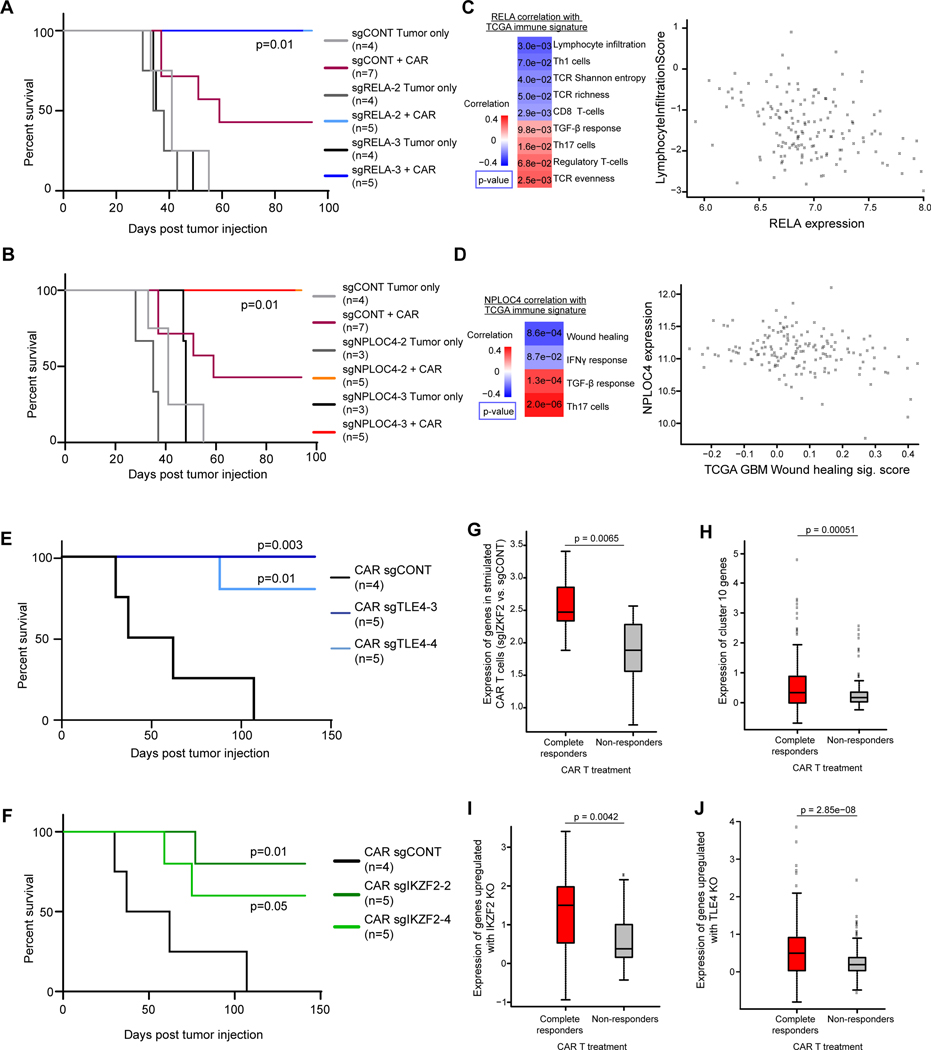
Figure 7. Functional and clinical relevance of targets on GSCs and CAR T cells.
A and B, Kaplan-Meier survival curves comparing mouse survival for RELA (A) or NPLOC4 (B) knockout with non-targeting controls. Tumors were established by orthotopically implanting 2×10⁵ PBT030–2 GSCs, and treated after 8 days with 5×10⁴ CAR T cells. P-values were shown comparing each group with “sgCONT+CAR” group using Log-rank test. C, Left: Correlation of RELA expression with immune and T cell signatures in TCGA GBM RNA-seq data. Right: Scatter plot of lymphocyte infiltration signature score vs. RELA expression by tumor from TCGA GBM RNA-seq data. D, Left: Correlation of NPLOC4 expression with immune and T cell signatures in TCGA GBM RNA-seq data. Right: Scatter plot of NPLOC4 expression vs. wound healing signature score by tumor from TCGA GBM RNA-seq data. (C, D) p-values were calculated as Pearson’s correlation coefficients. E and F, Kaplan Meier curves demonstrating prolonged survival in an intracranial xenograft model of GBM treated with TLE4KO (C) or IKZF2KO (D) CAR T-cells (blue) compared to non-targeting control (black). Tumors were established by orthotopically implanting 2×10⁵ PBT030–2 GSCs, and treated after 8 days with 2×10⁴ CAR T cells. P-values were shown comparing each group with the “CAR sgCONT” group using Log-rank test. FDR: False discovery rate. G, Fold change after stimulation of genes significantly upregulated (FDR < 0.05, Log2 fold change > 1) following IKZF2 knockout after tumor stimulation, in an independent dataset of clinical CAR T cells products from patients with CLL. H, Fold change after stimulation of genes enriched in cluster 10 as shown in Fig. 5. I and J, Fold change after stimulation of genes significantly upregulated (FDR < 0.05, Log2 fold change > 1) following IKZF2 (I) or TLE4 (J) knockout. (G-J) CAR T cells were stratified by response of the patient from which they were derived - complete responders or non-responders - to CAR therapy and the log2 fold change of stimulated vs. mock-stimulated gene expression was plotted, p-values were calculated by unpaired Student’s t tests.

