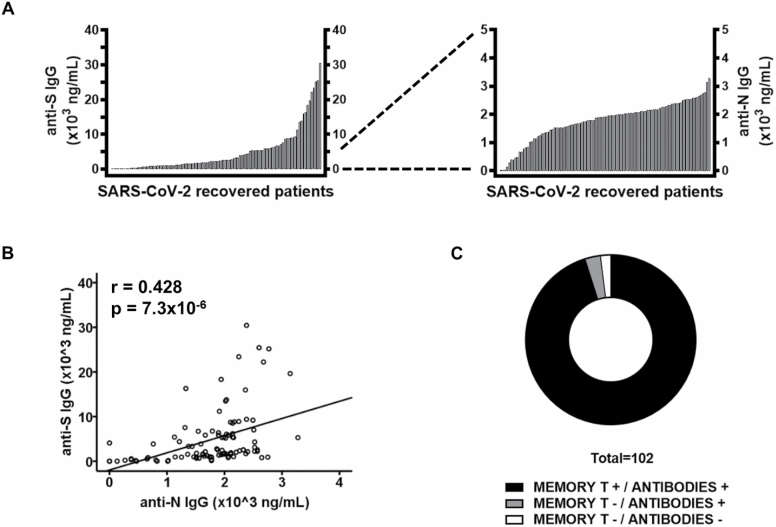
Figure 3.
Anti-S and anti-N-specific antibody titers in 102 patients who had recovered from severe acute respiratory syndrome coronavirus 2 (SARS-CoV-2) infection. (A) Serum titers of anti-S and anti-N IgG in 102 patients who had recovered from SARS-CoV-2. Data are shown as histograms. (B) The relationship between anti-S and anti-N IgG plasma titers was analyzed. Pearson correlation coefficients and probabilities are shown in the upper left-hand corner. (C) Distribution of patients according to their SARS-CoV-2-specific cellular and humoral memory.

