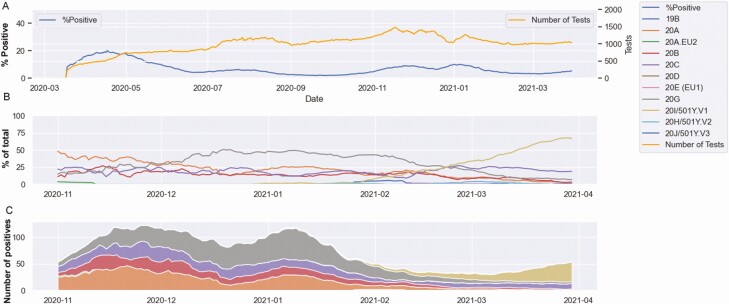
Figure 1.
Severe acute respiratory syndrome coronavirus 2 positivity and genotypes at Johns Hopkins Hospital. A, Percentage positivity among total molecular tests. B, Percentage clade distribution between November 2020 and March 2021. C, Stack plot of estimated number of cases per clade based on total number of cases per day and percentage sequenced within each clade. Data shown as 15-day rolling average.

