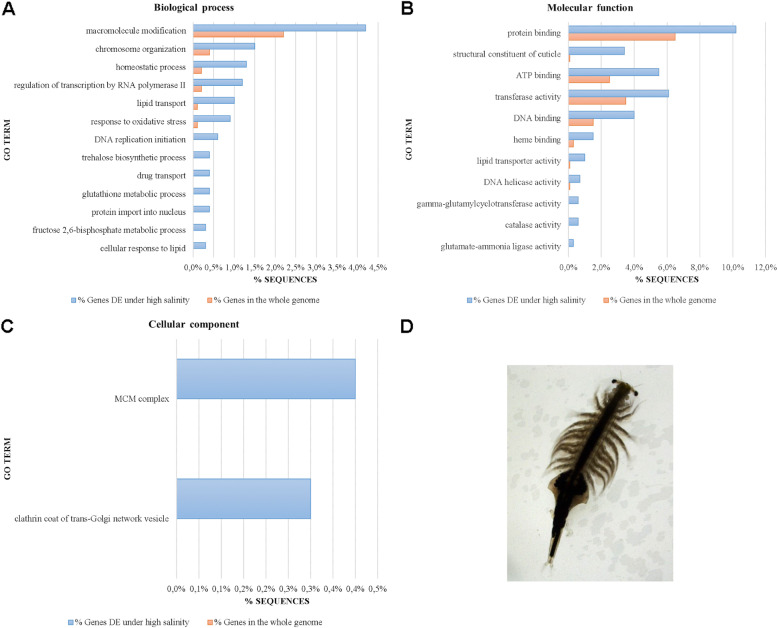
Fig. 4.
Significantly enriched gene ontologies (Fisher’s exact test, FDR ≤ 0.05) in the differentially expressed gene list under high salinity in Artemia. Biological processes (A), molecular functions (B) and cellular components (C) for genes differentially expressed under high salinity are shown. GO terms are sorted from the largest (top of the graph) to the smallest difference (bottom of the graph) between % sequences in the whole genome and in DE genes. Enrichment was done by removing sequences present in both test set and reference set from the reference only, but not from the test set, which makes the test more sensitive towards the test set, but can lead to zero values in the reference set. D Binocular image of an adult female A. franciscana

