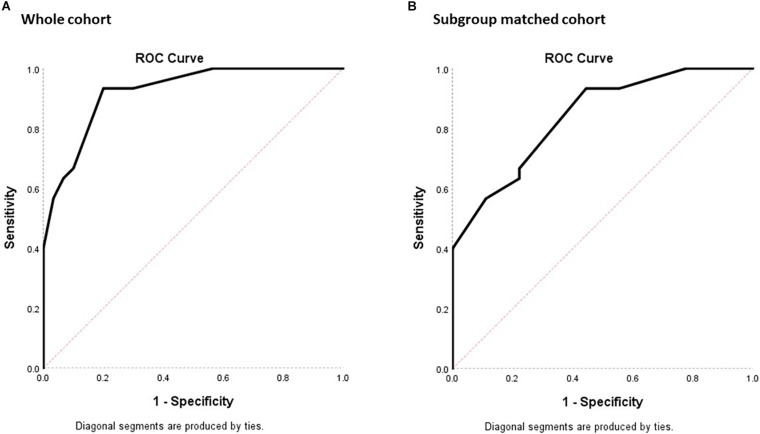
FIGURE 3.
ROC plots of sensitivity against 1- specificity for the MoCA-HA tool of the NC-HI and the MCI-HI cohort to demonstrate the screening property of the tool. (A) The 30 NC-HI and 30 MCI-HI cohorts. (B) The age/education-matched 9 NC-HI and 30 MCI-HI cohorts. (The diagonal line demonstrates no significant diagnostic property for the dichotomous outcome with sensitivity = 50% and specificity = 50%).

