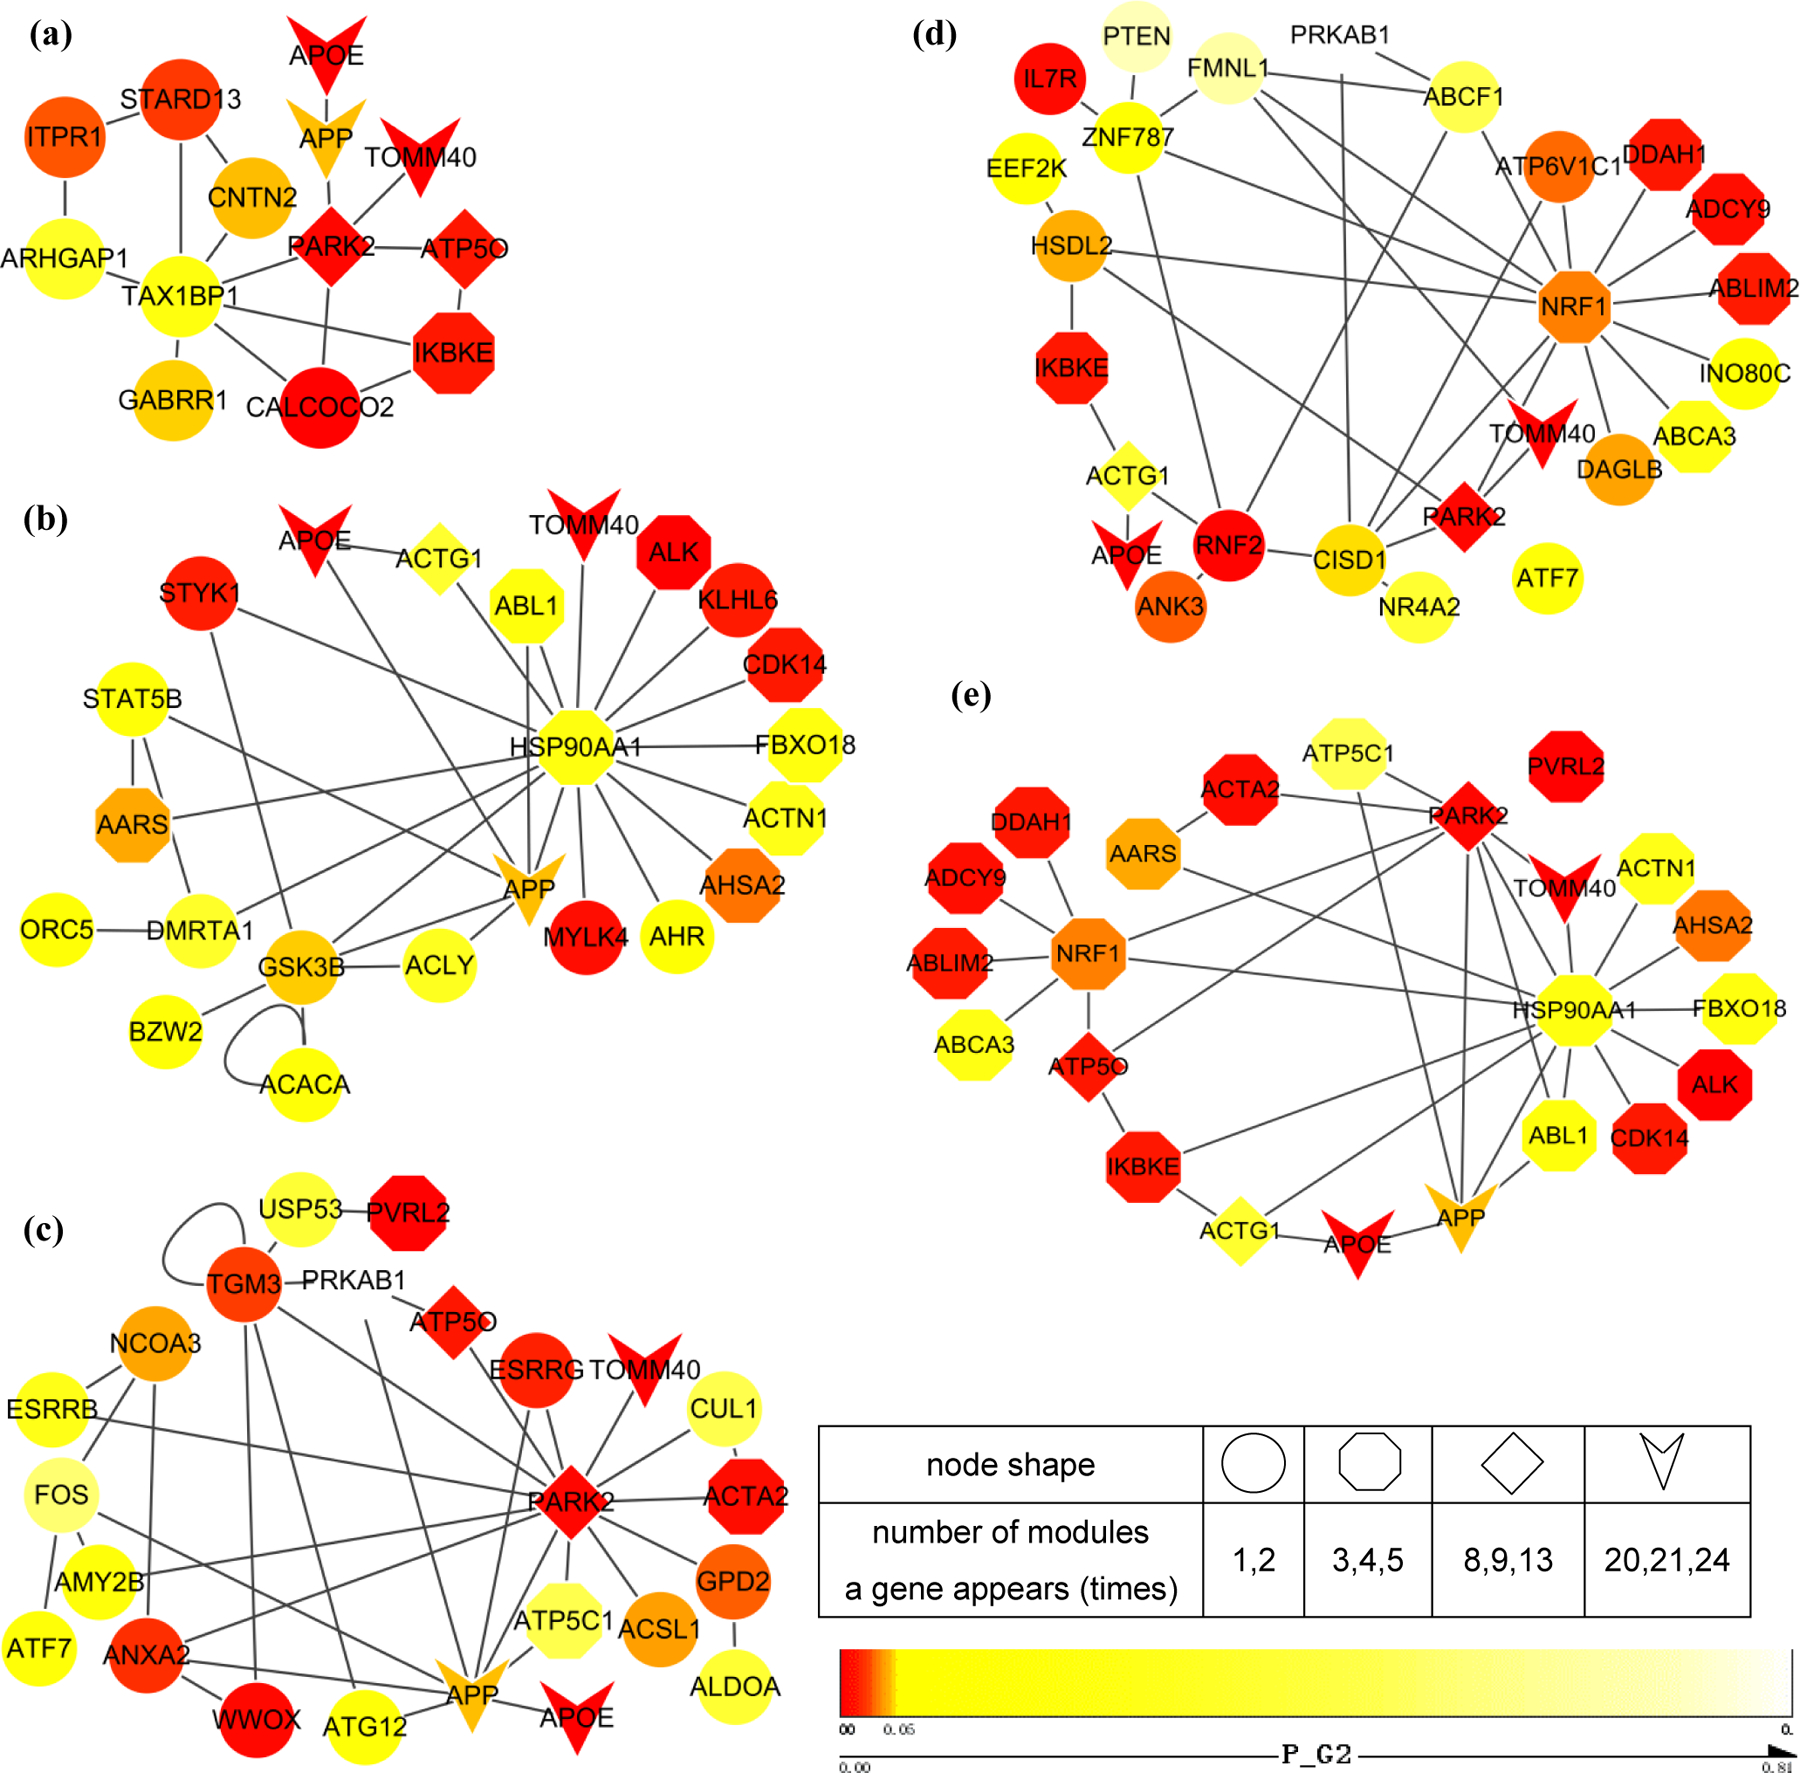
Figure 4. Subnetworks composed of clustered modules with the Jaccard similarity coefficients larger than 0.5.

(a) The most significant module; (b) Subnetwork composed of M4,M9,M10,M16,M24; (c) Subnetwork composed of M13,M15,M19,M21,M23; (d) Subnetwork composed of M2,M7,M22; (e) Subnetwork with genes appearing in more than 3 modules. P-values from genome-wide association analysis of G2 are color-mapped. Node shape represents the number of modules a gene appears in.
