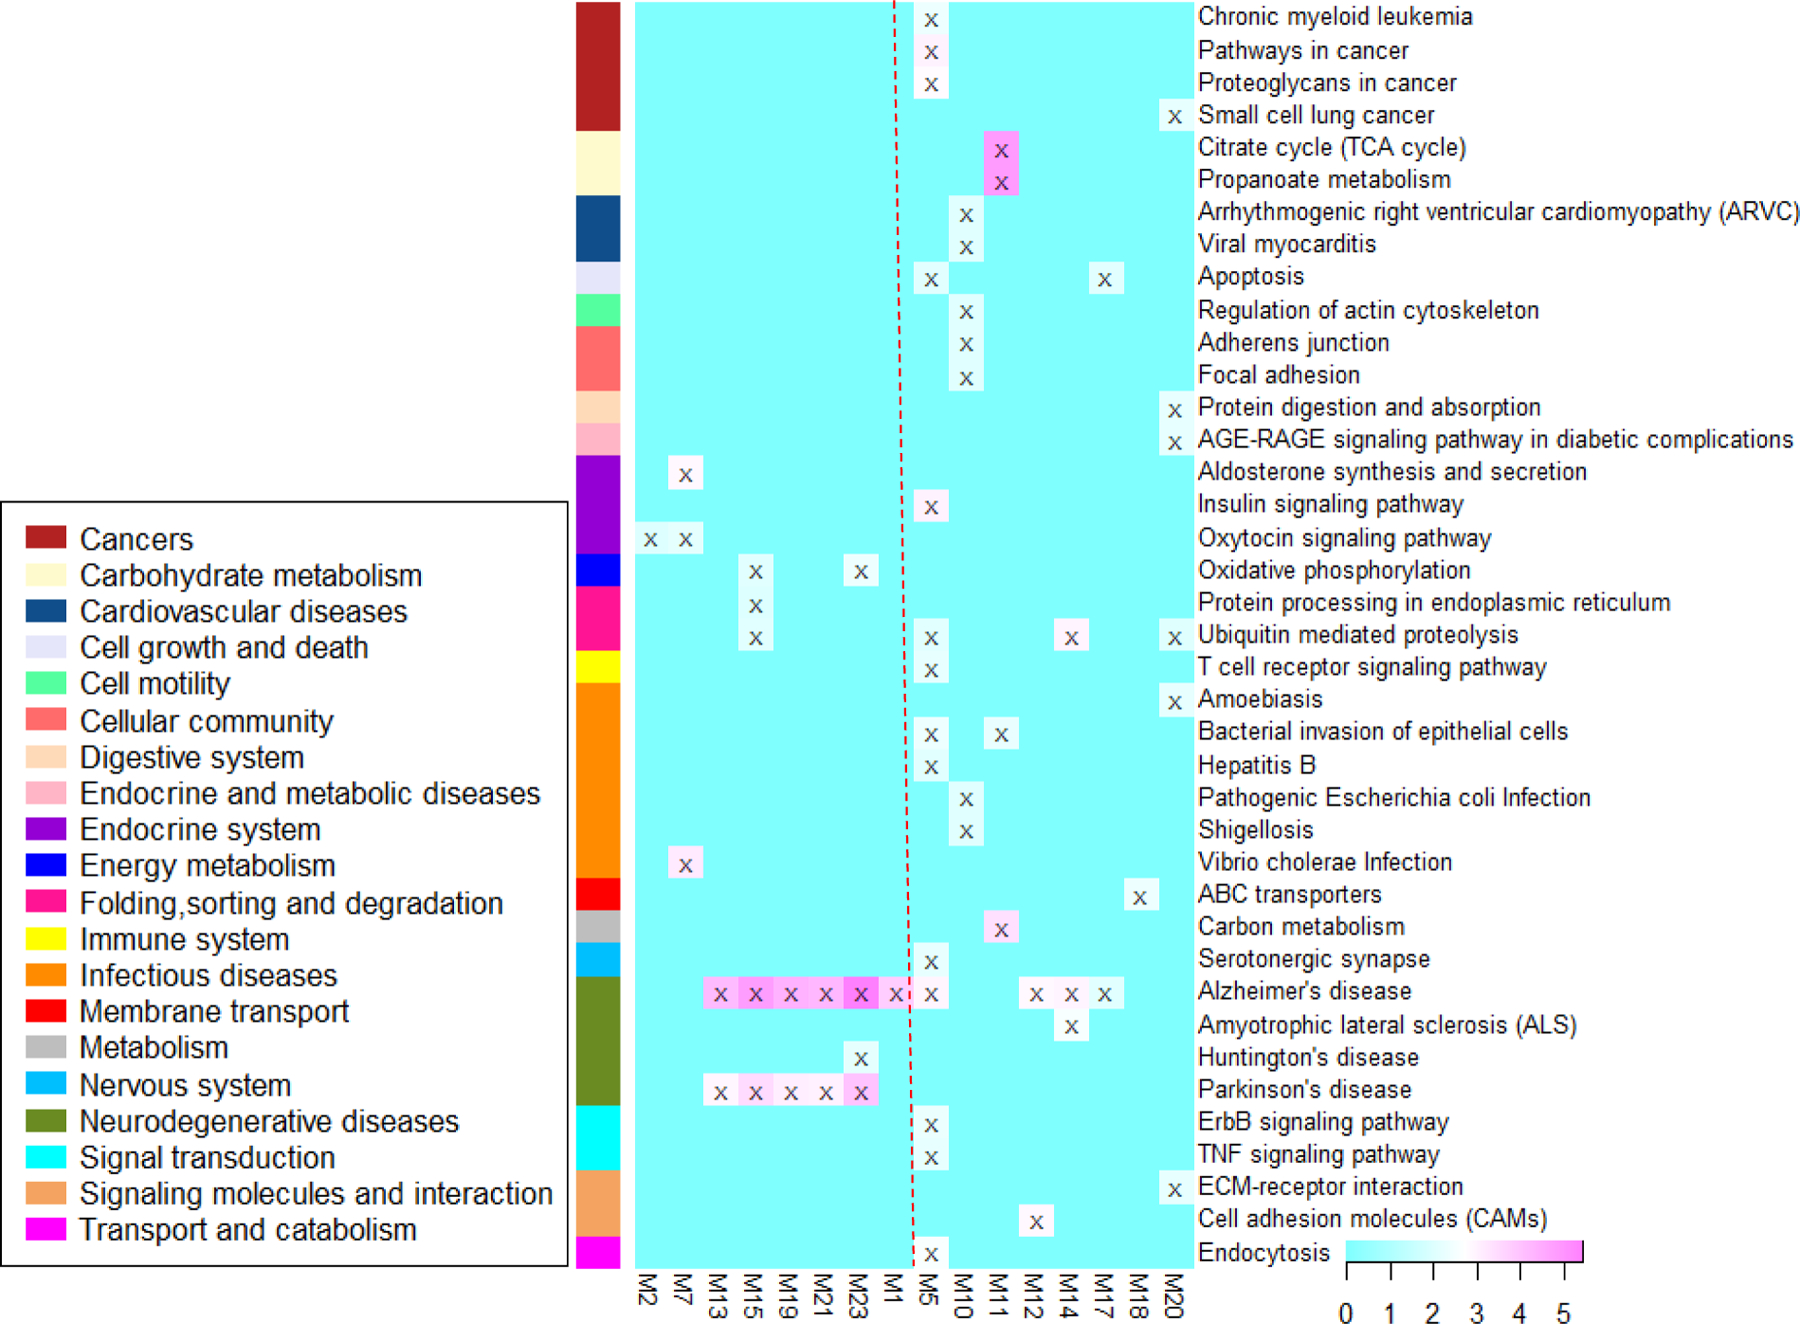
Figure 5. Heat map of pathway enrichment analysis at the significance level of P<0.01.

–log10(P-values) from each analysis are color-mapped in the heat map. Heat map blocks labeled with “x” reach the adjusted significance level of P<0.01. Each row (pathways) and column (modules) with at least one “x” block are included in the heat map. Modules on the left of the red dotted line are clustered modules. The remaining modules are on the right.
