
4.
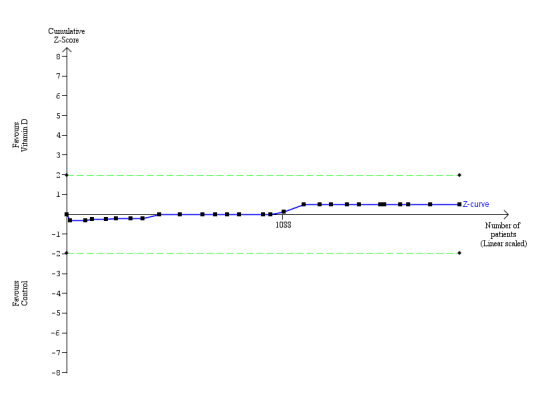
All‐cause mortality.
Trial Sequential Analysis was performed based on a mortality in the control group of 2%, a relative risk reduction of 20% in the experimental intervention group, a type I error of 1.25%, and a type II error of 10% (90% power). There was no diversity. The required information size was 63,116 participants. The cumulative Z‐curve (blue line) did not cross the trial sequential monitoring boundary for benefit or harm after the 27th trial. The trial sequential monitoring boundaries were ignored due to little information (3.14%). The blue line represents the cumulative Z‐score of the meta‐analysis. The green dotted lines represent the conventional statistical boundaries.