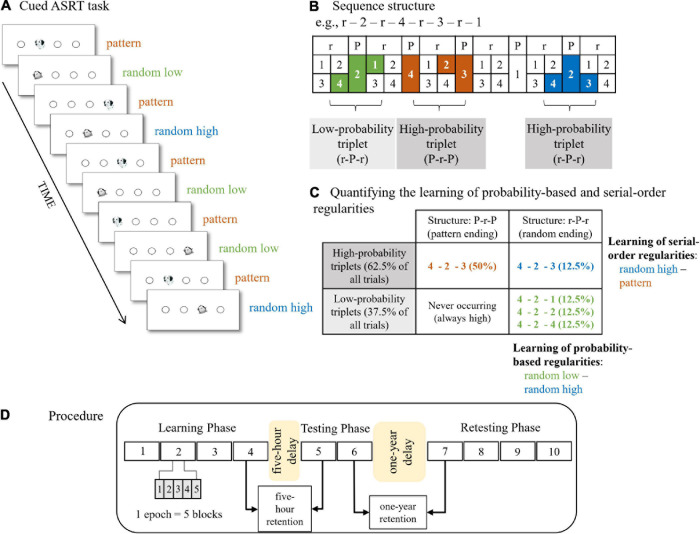
FIGURE 1.
The cued Alternating Serial Reaction Time (ASRT) task and experimental procedure. (A) Pattern and random trials were presented in an alternating fashion. Pattern trials were represented by a dog’s head and random trials were represented by a penguin. (B) An example of the sequence structure. In the example sequence, numbers mark pattern trials and “r” marks a randomly selected location out of the four possible locations. The alternating presentation of trials makes some runs of three consecutive trials (called triplets) more probable than others, labeled as high-probability and low-probability triplets, respectively. High-probability triplets can end either with a pattern or a random trial, whereas low-probability triplets always end with a random trial. Therefore, we can differentiate pattern triplets which are always of high probability (orange shading in panel B and orange font in panel C), random high-probability triplets (blue shading in panel B and blue font in panel C), and random low-probability triplets (green shading in panel B and green font in panel C). (C) Quantifying the underlying learning processes in the task. Learning of probability-based regularities is quantified by contrasting the RTs on the random high and random low trials (blue vs. green, the right column of the table). Learning of serial-order regularities is calculated by contrasting the RTs on the pattern and random high trials (orange vs. blue, the top row of the table). (D) The design of the experiment. The experiment consisted of three sessions. The Learning Phase and Testing Phase were administered on the same day with a 5-hour offline period between them. The Learning Phase was composed of four epochs (one epoch contained 5 blocks, and each block consisted of 85 stimuli) and the Testing Phase was composed of two epochs. The four-epoch-long Retesting Phase was administered ca. 1 year later. Figures 1A–C are adapted from Nemeth et al. (2013) and Zavecz et al. (2020), Figure 1D is adapted from Kóbor et al. (2017).

