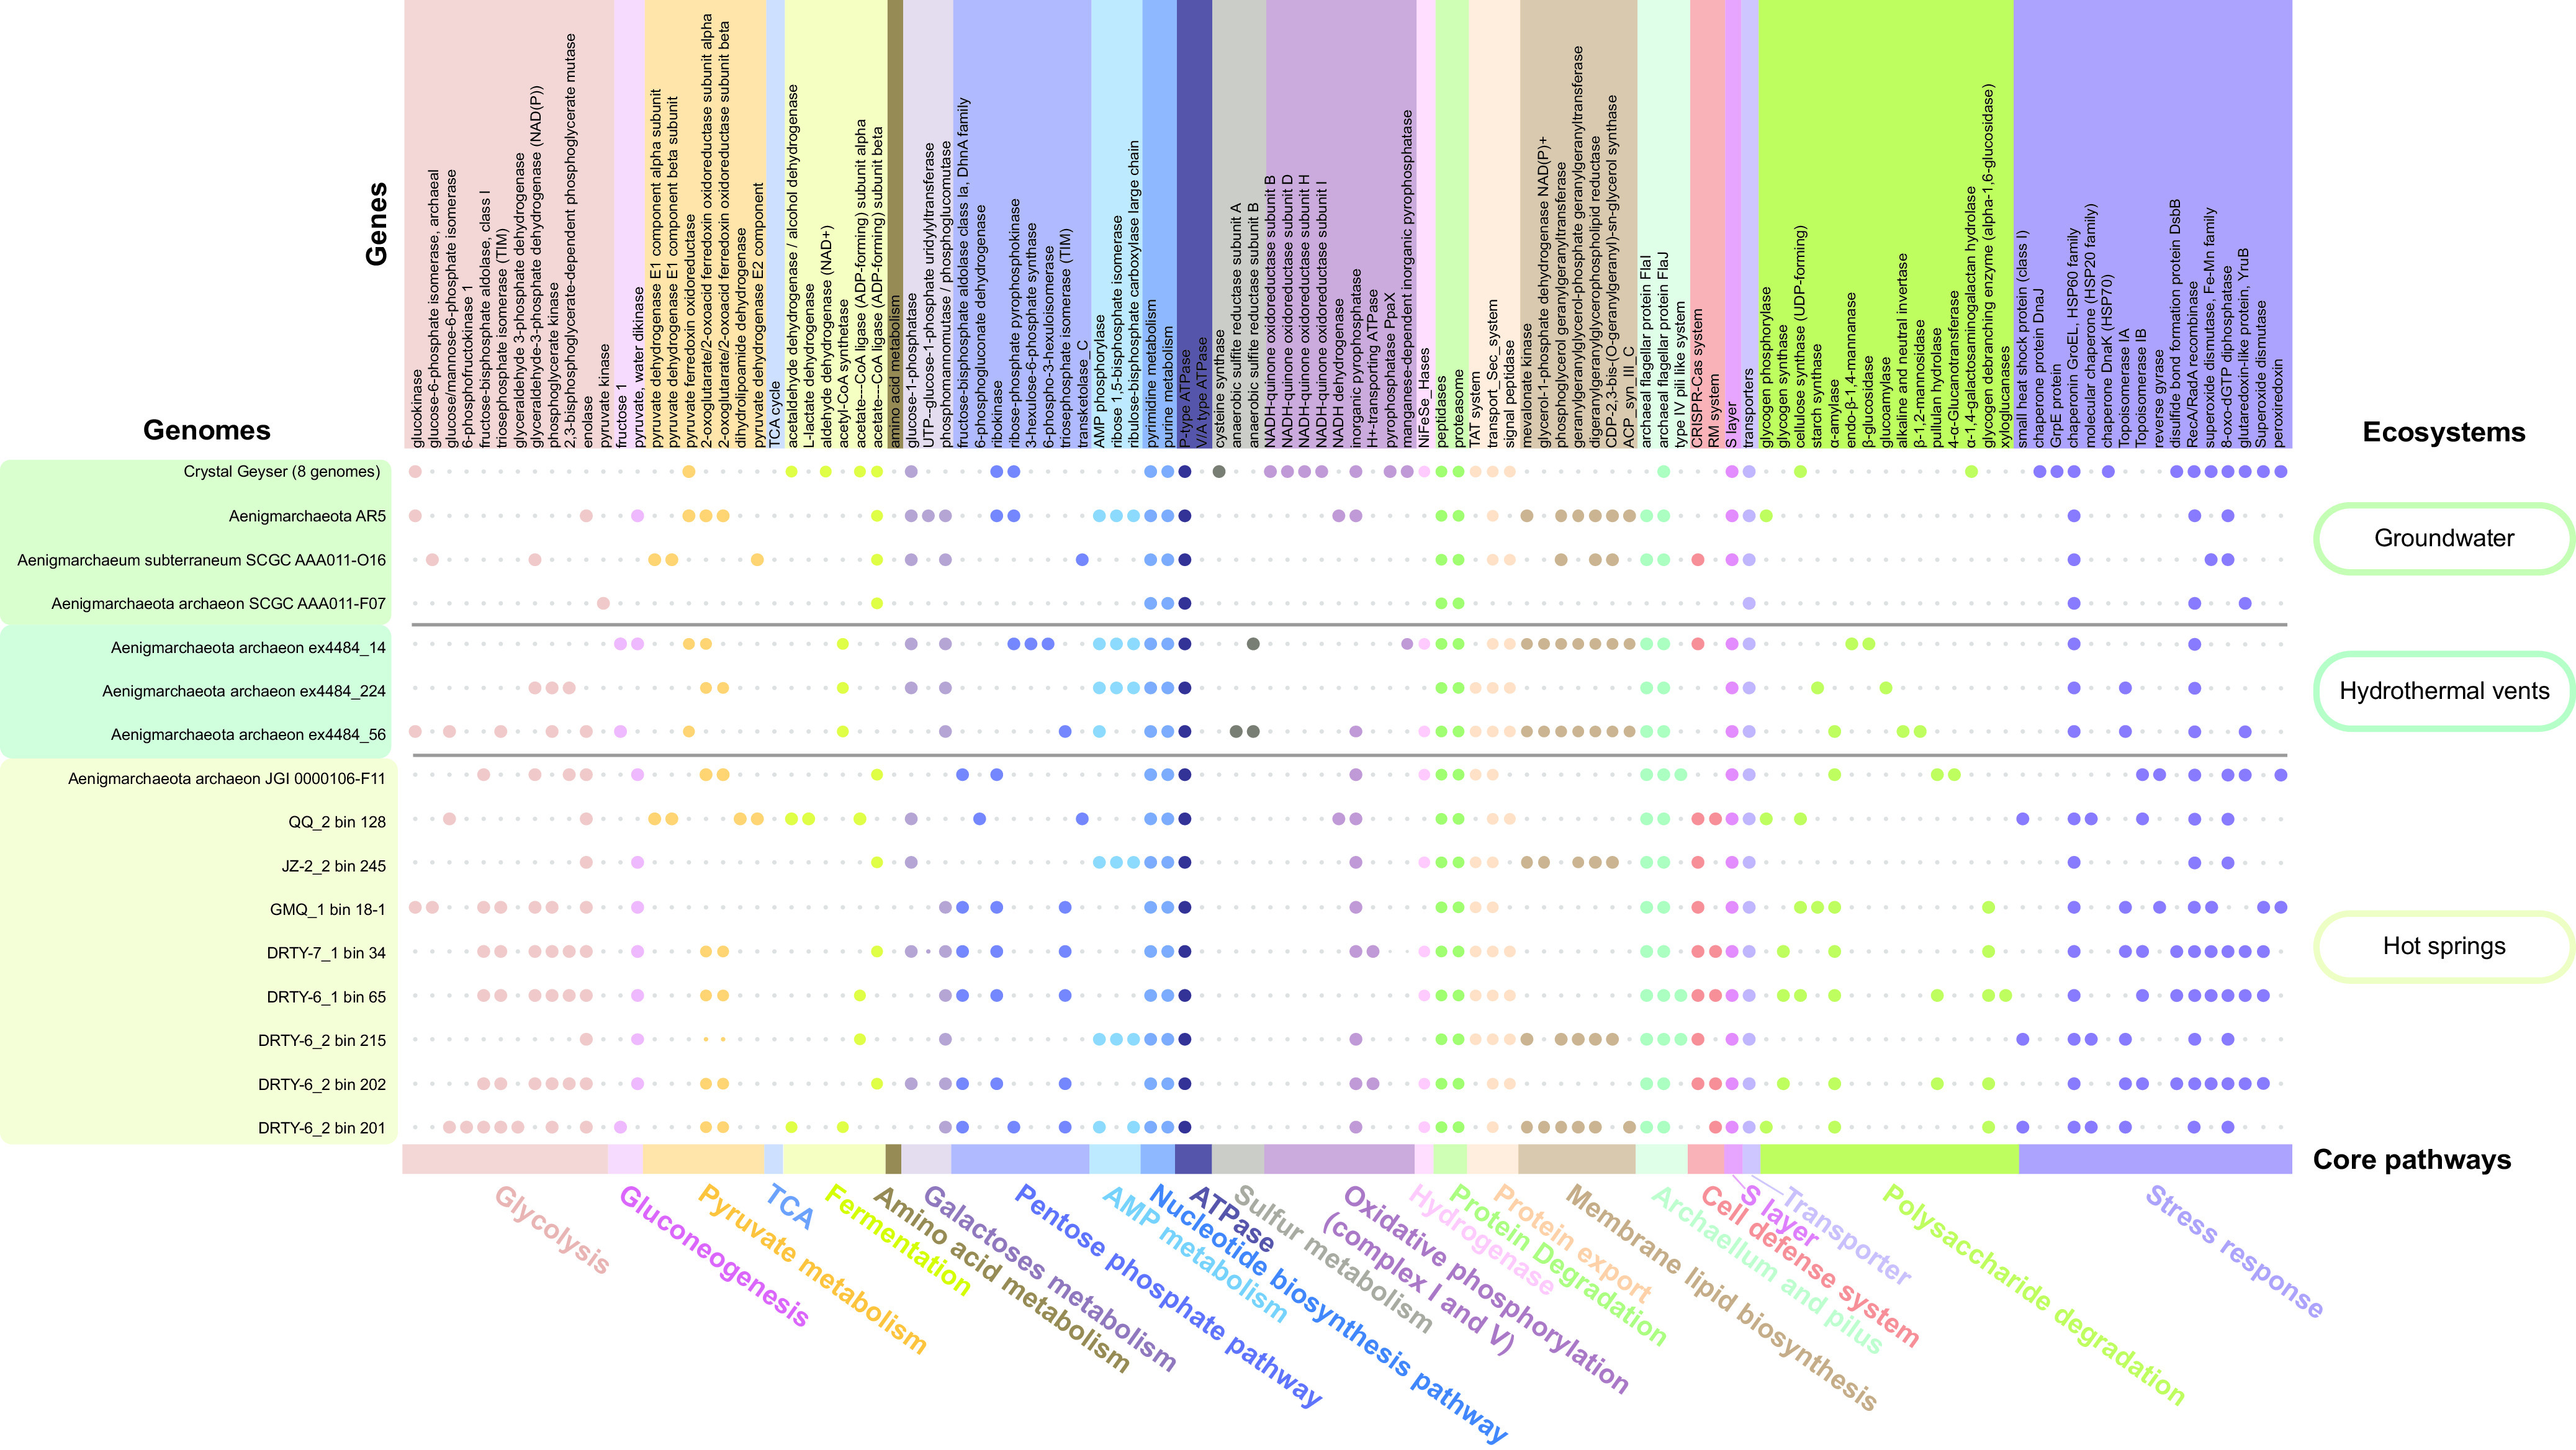
FIG 4.

The core metabolic pathways with the presence/absence of genes of all “Ca. Aenigmarchaeota” genomes. The metabolic potential (columns) is mainly generated based on KEGG orthologs (KOs), clusters of orthologous groups (COGs), and archaeal clusters of orthologous groups (arCOGs). Genomes (rows) of “Ca. Aenigmarchaeota” were clustered by ecosystems. Eight genomes obtained from groundwater in Crestal Geyser were shown as one row because of the high metabolic similarity of the eight genomes. Small gray dots represent genes or metabolic pathways that were absent, and big dots represent genes or metabolic pathways that were present. Distinct metabolic pathways were distinguished by different colored dots. See Data Set S1 in the supplemental material for details.
