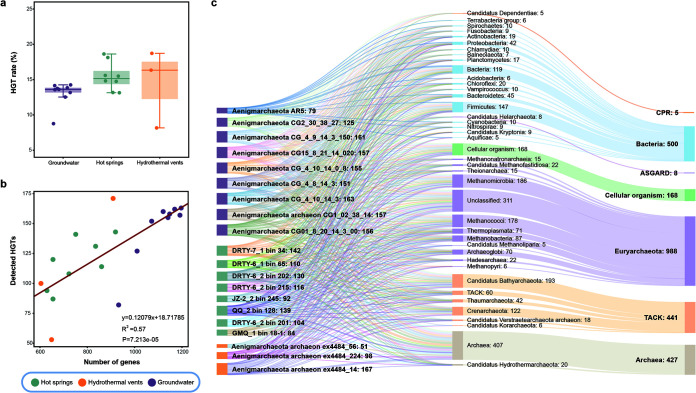
FIG 5.
The identified horizontally gene transfers (HGTs) in genomes from this study, hydrothermal vents, and groundwater. (a) Comparisons of HGT rates between these three groups. (b) A linear regression analysis was conducted to model the relationship between genomes size and detected interphylum HGTs. The fitted formula was shown on the plot with R2 = 0.57 and P = 7.213E−05. (c) The Sankey plot shows the detected interphylum HGTs and potential donors for each genome. Number of donors that were below five were removed. Interphylum HGTs were detected using HGTector as described in Materials and Methods.

