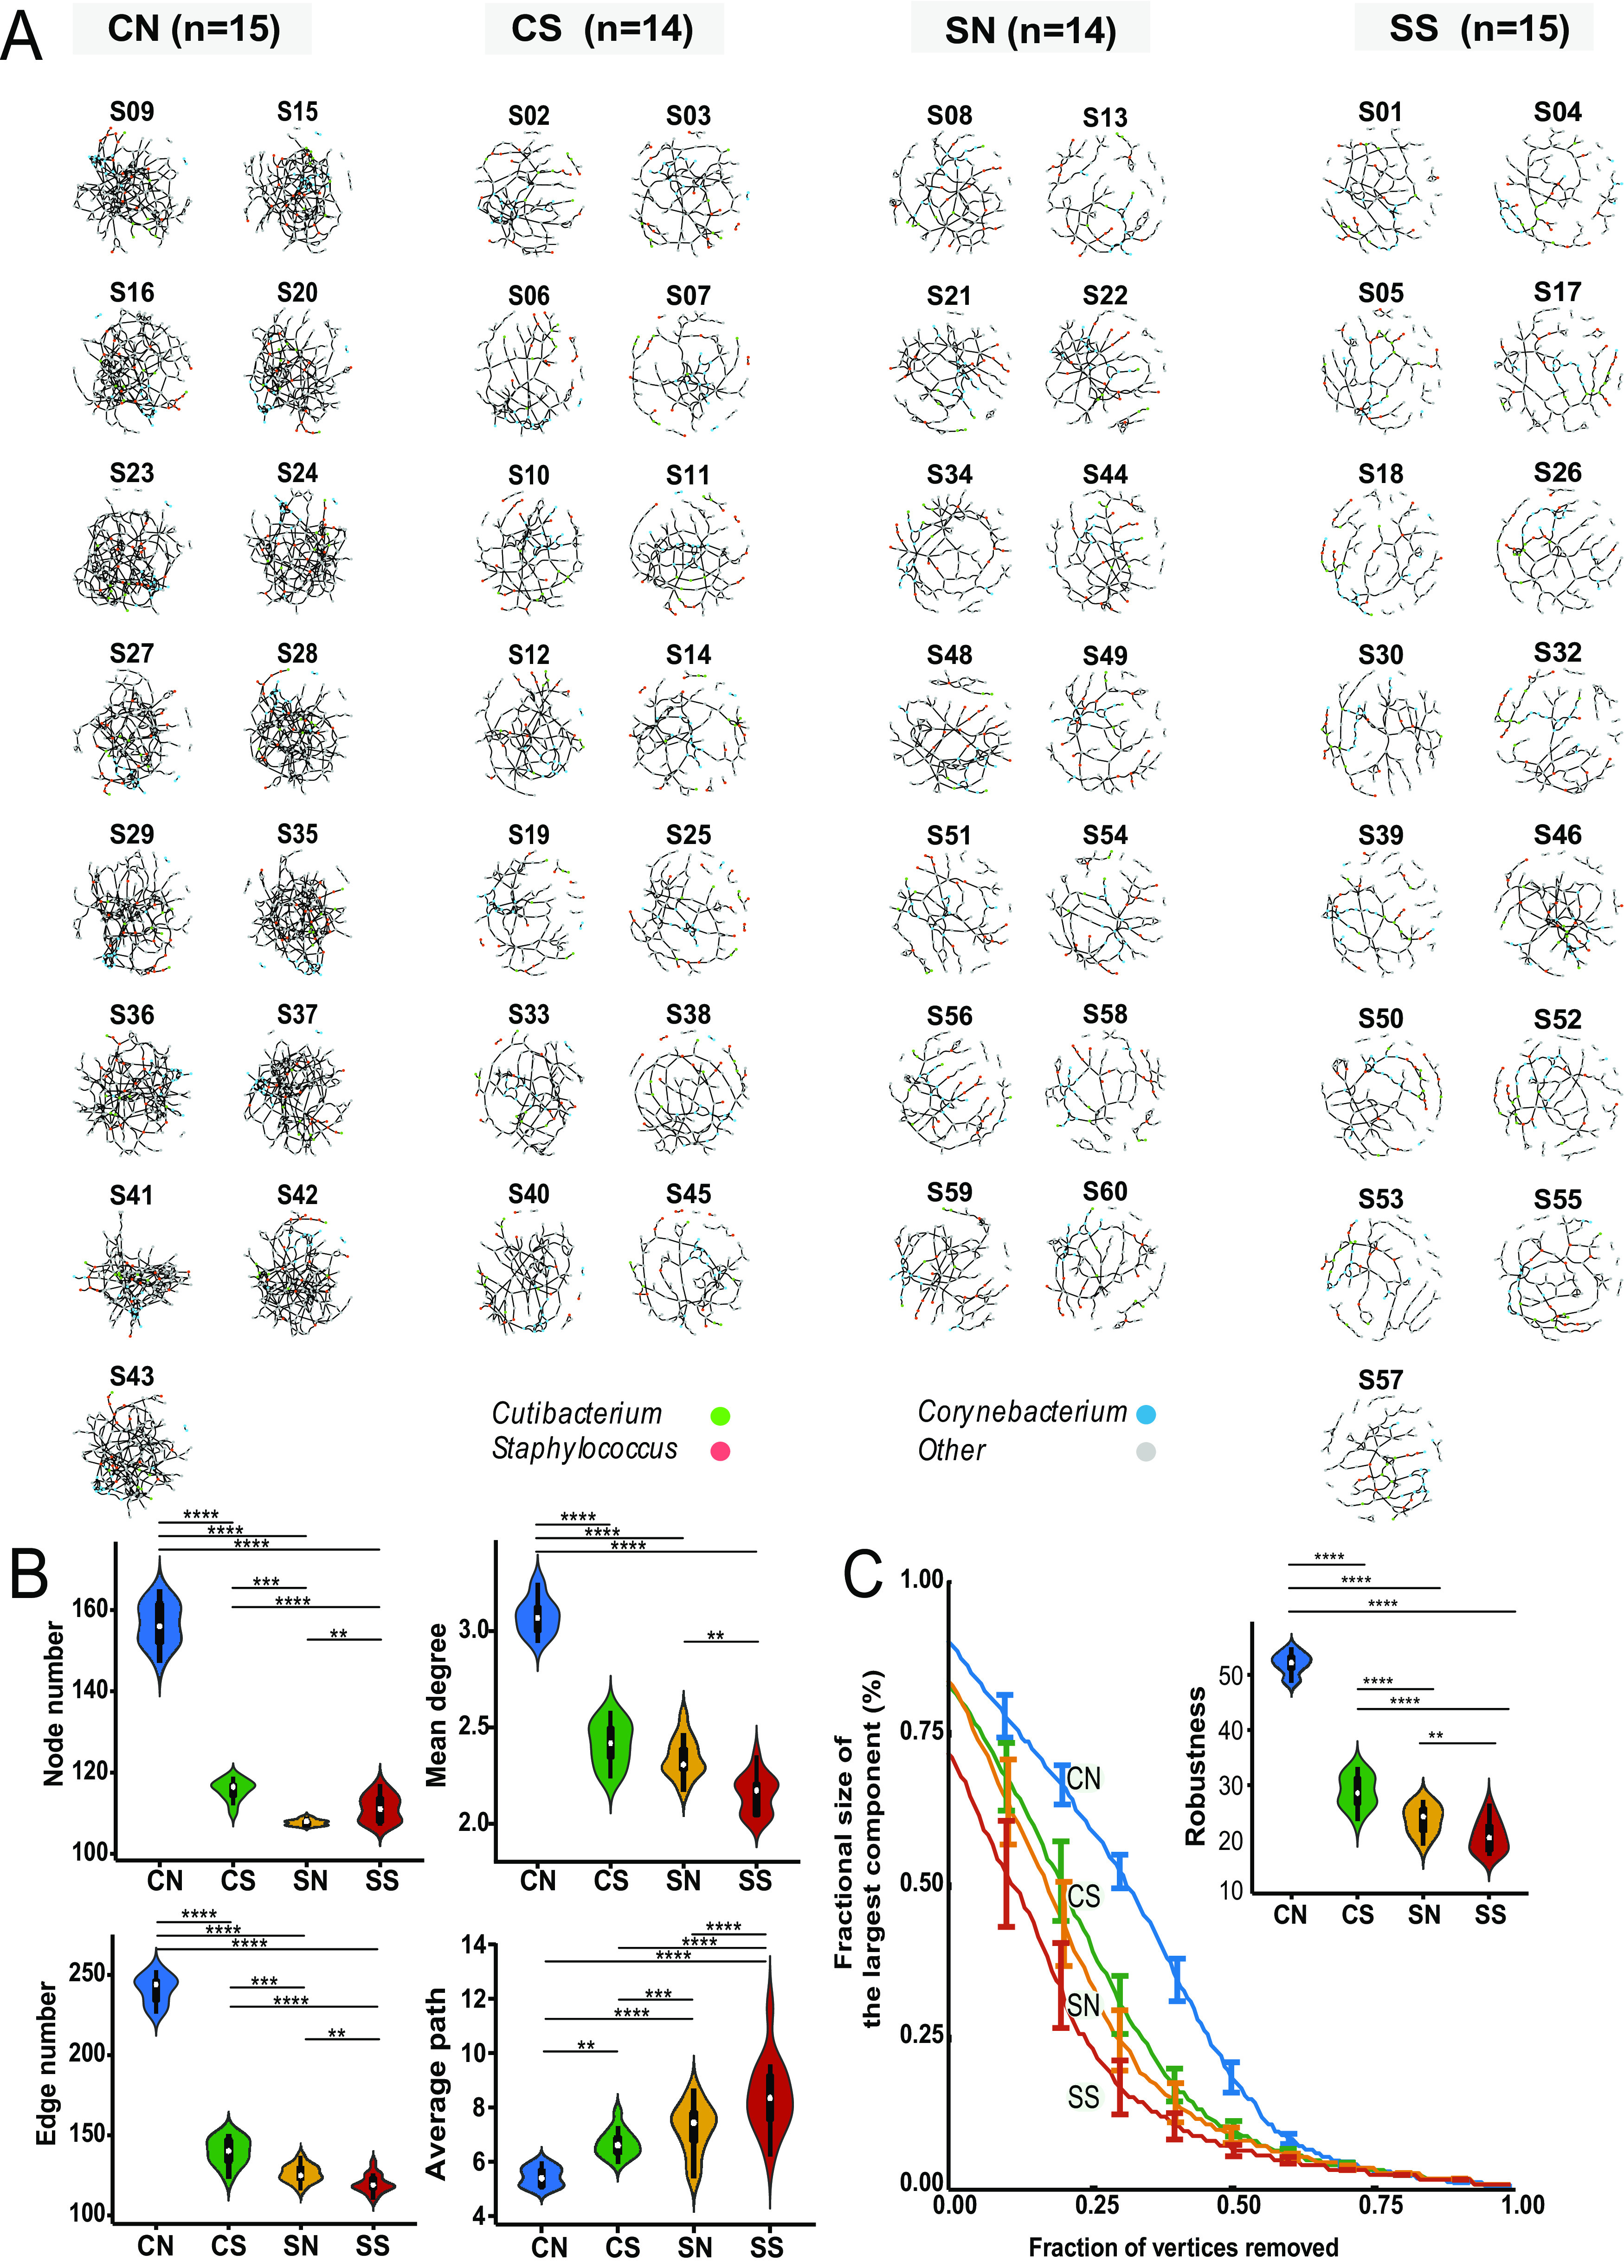
FIG 3.

Analysis of the microbiome network of individual (MNI) for each subject under different pollution conditions. There were 58 MNIs corresponding to 58 subjects, respectively. (A) The MNI of each subject. Fifteen MNIs of the 15 subjects in the lowest-pollution group (CN) had the densest connections between the four groups. Three dominating genera (accounting for over 50% of the total abundance of all species), Cutibacterium (green), Corynebacterium (blue), and Staphylococcus (red), were colored. (B) Violin chart demonstrating the connectivity property of MNIs for each group of subjects, including node number, edge number, mean degree, and average path (Wilcox test P value: **, <0.05; ***, <0.001; ****, <0.0001). Clearly, the network connectivity decreased (CN > CS > SN > SS) with decreased pollution stress. (C) Line chart with error bars (median) demonstrated the fragility change as nodes were removed in each MNI network. The robustness of MNIs decreased (CN > CS > SN > SS) with decreased pollution stress and was consistent with the result of MNP. Both a larger area under the curve and a higher robustness value indicated the corresponding network was more robust.
