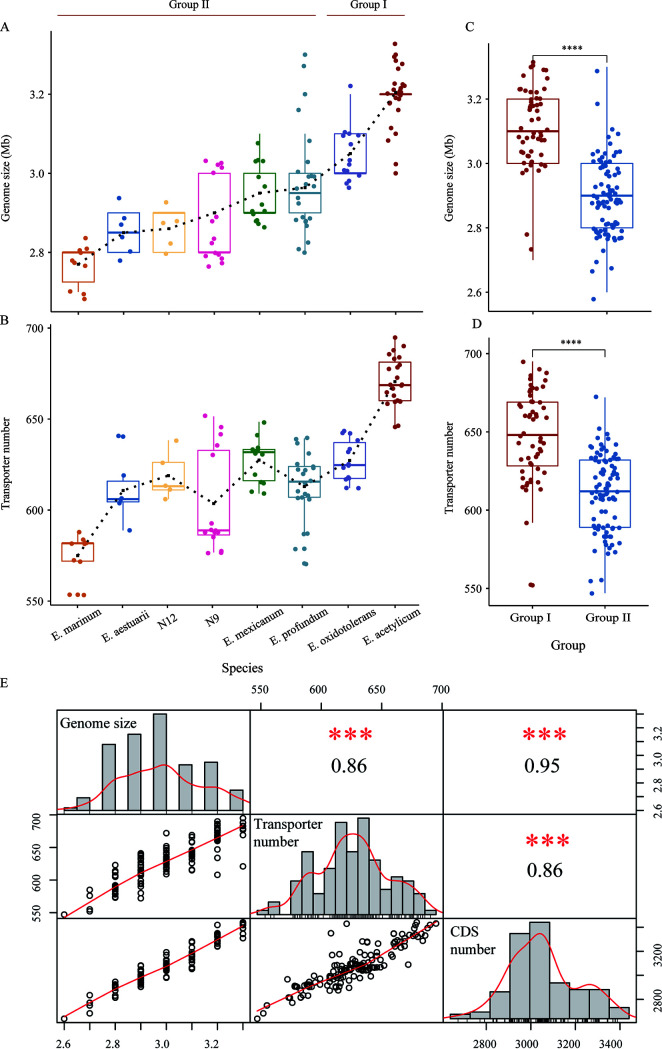
FIG 5.
Comparison and Spearman’s correlation analysis of genome sizes and transporter numbers. (A) Trends in the genome sizes of Exiguobacterium species (species with at least 5 strains were selected to show the trends). (B) Trends in the transporter numbers of Exiguobacterium species (species with at least 5 strains were selected to show the trends). (C) Comparison of genome sizes between group I and group II. (Black ****, significantly different at a P of <0.0001, as assessed by Wilcoxon tests). (D) Comparison of transporter numbers between group I and group II. (E) Spearman’s correlation analysis of genome sizes, CDS numbers, and transporter numbers. The genome size, CDS number, and transporter number are shown in the central diagonal, and the scatterplots are depicted with a fitted red line. On the corresponding side for each pairing is the Spearman rank correlation coefficient, rs. (Red ***, P < 0.01).

