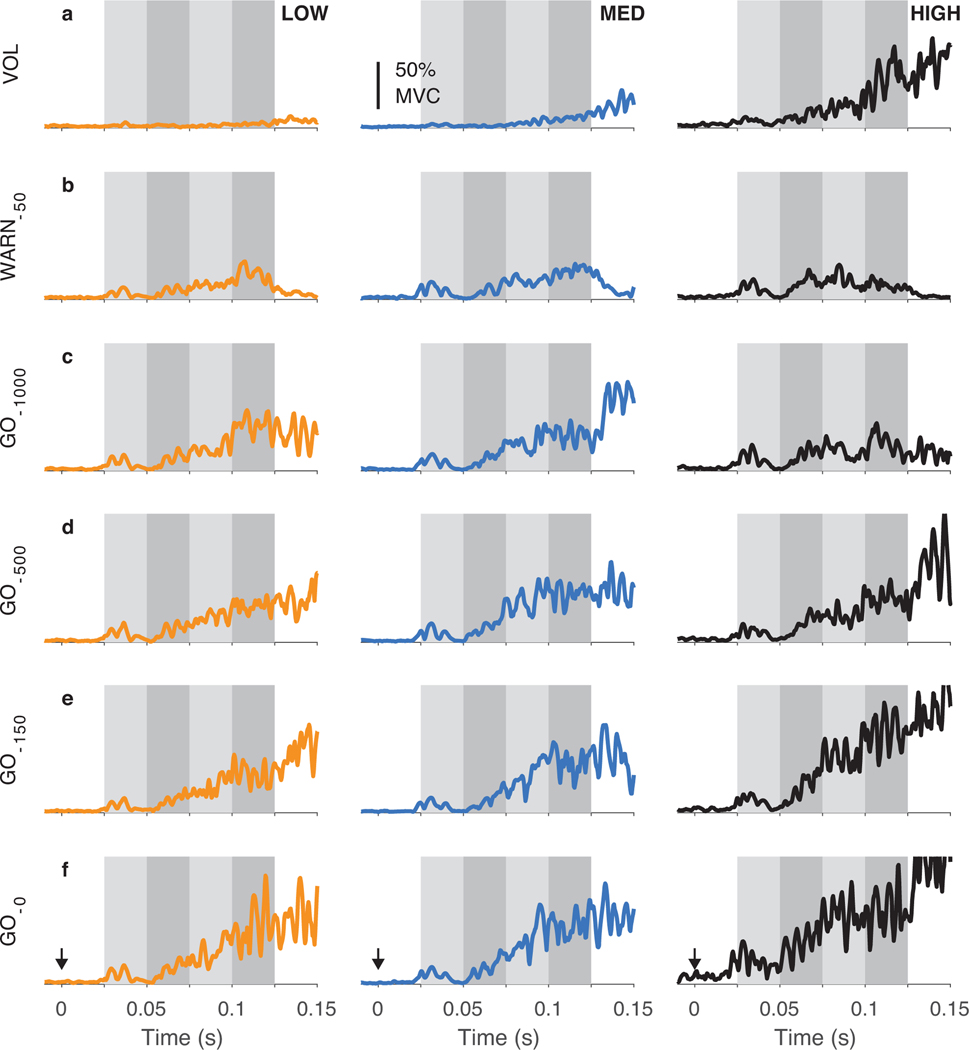
Fig. 2.
Representative data from one participant during the LOW (left column) MED (center column) and HIGH (right column) temporal certainty conditions. Traces show the average triceps EMG during voluntary reaching (row a) and in response to the five probe perturbation times used in these experiments (rows b–f). Each trace is the average of ten trials; trials for the voluntary reaching were selected randomly from all available trials. Responses were later analyzed in the four time windows illustrated (25–50 ms, 50–75 ms, 75–100 ms, 100–125 ms).

