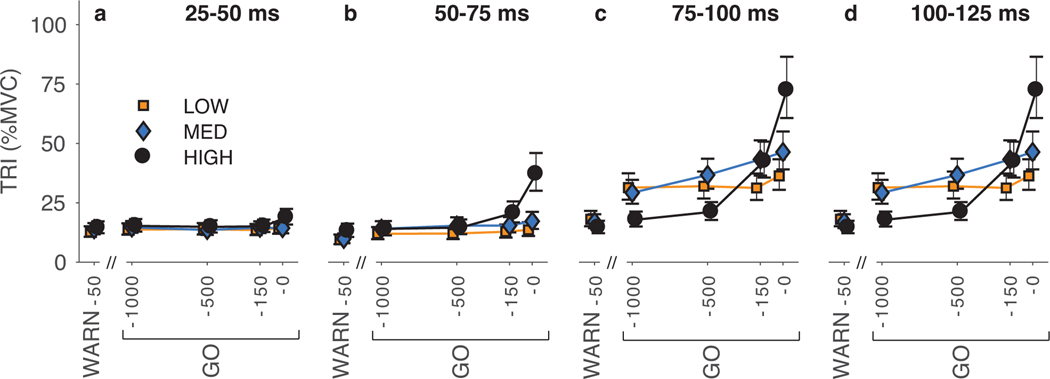
Fig. 3.
The magnitude of the average TRI muscle response elicited by a perturbation is affected by temporal certainty condition and probe perturbation time. Responses are quantified in four time windows: (a) 25–50 ms, (b) 50–75 ms, (c) 75–100 ms, and (d) 100–125 ms as the fitted mean ± standard error from the statistical analysis. Differences in the response magnitude are most notable beginning in the period from 75–100 ms following the perturbation. Some differences are seen from 50–75 ms. See Results section for statistical comparisons.

