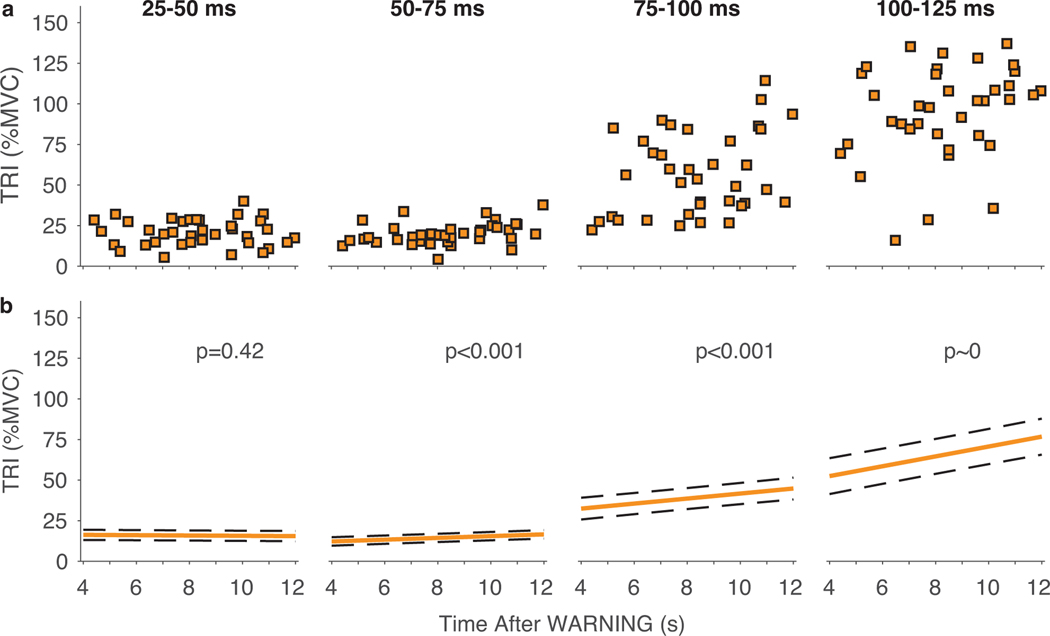
Fig. 4.
(a) Representative data for a typical participant in the LOW certainty condition. Data are the magnitude of the TRI muscle response elicited by the probe perturbations in individual trials. Responses are quantified in four time windows: 25–50 ms, 50–75 ms, 75–100 ms, and 100–125 ms. All responses are plotted against the time after the WARNING when the probe perturbation was delivered. (b) Modeled group results across all subjects. Solid lines represent the mean response for the modeled fixed effects. Dashed lines represent the confidence intervals on these effects. P-values are for the slope of the relationship between the TRI response magnitude and time between the WARNING cue and perturbation onset.

