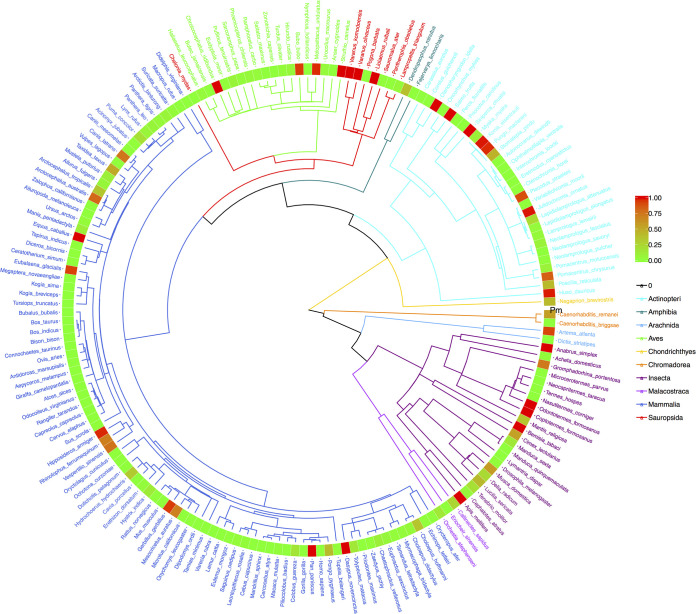
FIG 3.
The phylogenetic tree of 179 animal species, annotated with the Pm values from their MSN (multisite neutral model) testing at metacommunity level. (i) Branches and species labels constitute a standard phylogenetic tree and were colored differently for each of the 10 animal classes (each color of the branches represents an animal class, and species labels were colored in terms of their class identities). (ii) The band of mosaic color is a heatmap representing the size of the Pm value. The Pm value ranged between 0 (green) and 1 (red) and is used to determine the outcome of neutrality testing as explained in the manuscript. The closer the color is to red in the heatmap, the greater the Pm value (the more likely being neutral); and the closer the color is to green, the smaller the value (the less likely being neutral).

