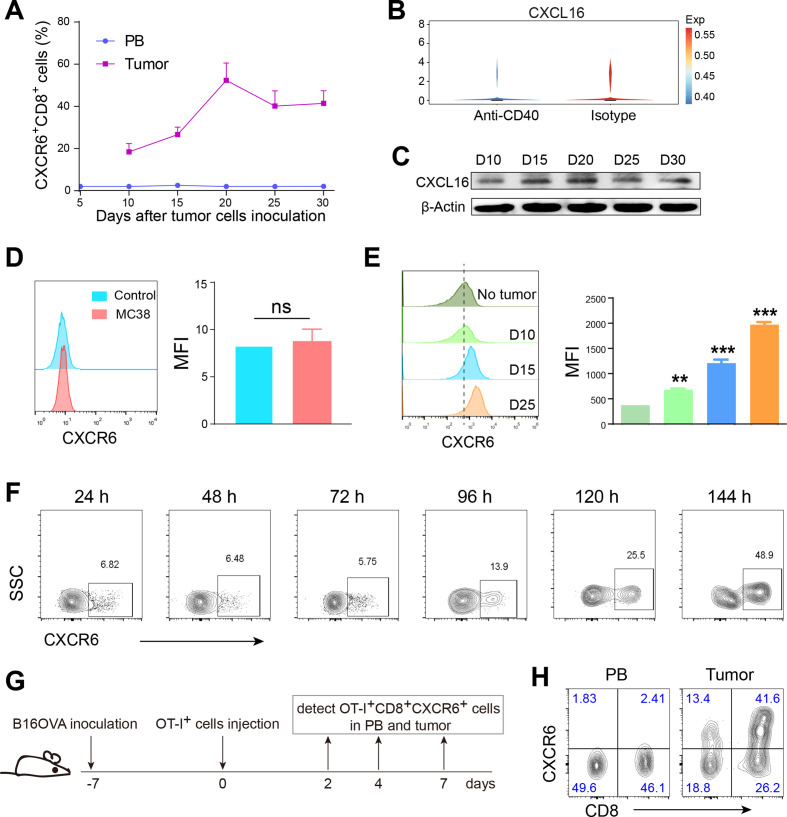
Figure 5.
High tumor expression of CXCR6 was induced by tumor tissue rather than tumor cells. (A) Timing course of proportions of CXCR6+CD8+ T cells in peripheral blood (PB) and tumor tissues from tumor burden mice. (B) Violin plot showing the expression of CXCL16 after treatment with isotype control or anti-CD40 agonist. (C) Western blot showing intratumoral CXCL16 expression. (D and E) Expression of CXCR6 on CD8+ T cells was detected after coculture with MC38 tumor cells (D) or conditional coculture with disrupted tumor tissues (E). Shredded tumor tissues were in upper wells and naïve T cells in lower wells with the presence of IL-2 recombinant cytokine and CD3/CD28 functional antibodies. (F) Timing course of expression of induced CXCR6 in vitro after conditional coculture with shredded tumor tissues. (G) Schematic diagram of inducing expression of CXCR6 in vivo. Mice were inoculated subcutaneously with B16OVA tumor cells. A week later, naïve OT-I T cells were injected into tumor load mice by tail vein and then detected OT-I+CXCR6+CD8+ T cells in PB and tumor tissue on day 2/4/7. (H) Representative density showing the proportion of CXCR6+CD8+ T cells in Pb and tumor tissue on day 4. Displayed flow graph were gated on OT-I positive cells. Data are presented as the mean±SEM. *P<0.05, **p<0.01, and ***p<0.001. Single-cell RNA sequencing data were analyzed on website http://crcleukocytecancer-pkucn/. CXCR6, C-X-C motif chemokine receptor 6; NS, no significant.

