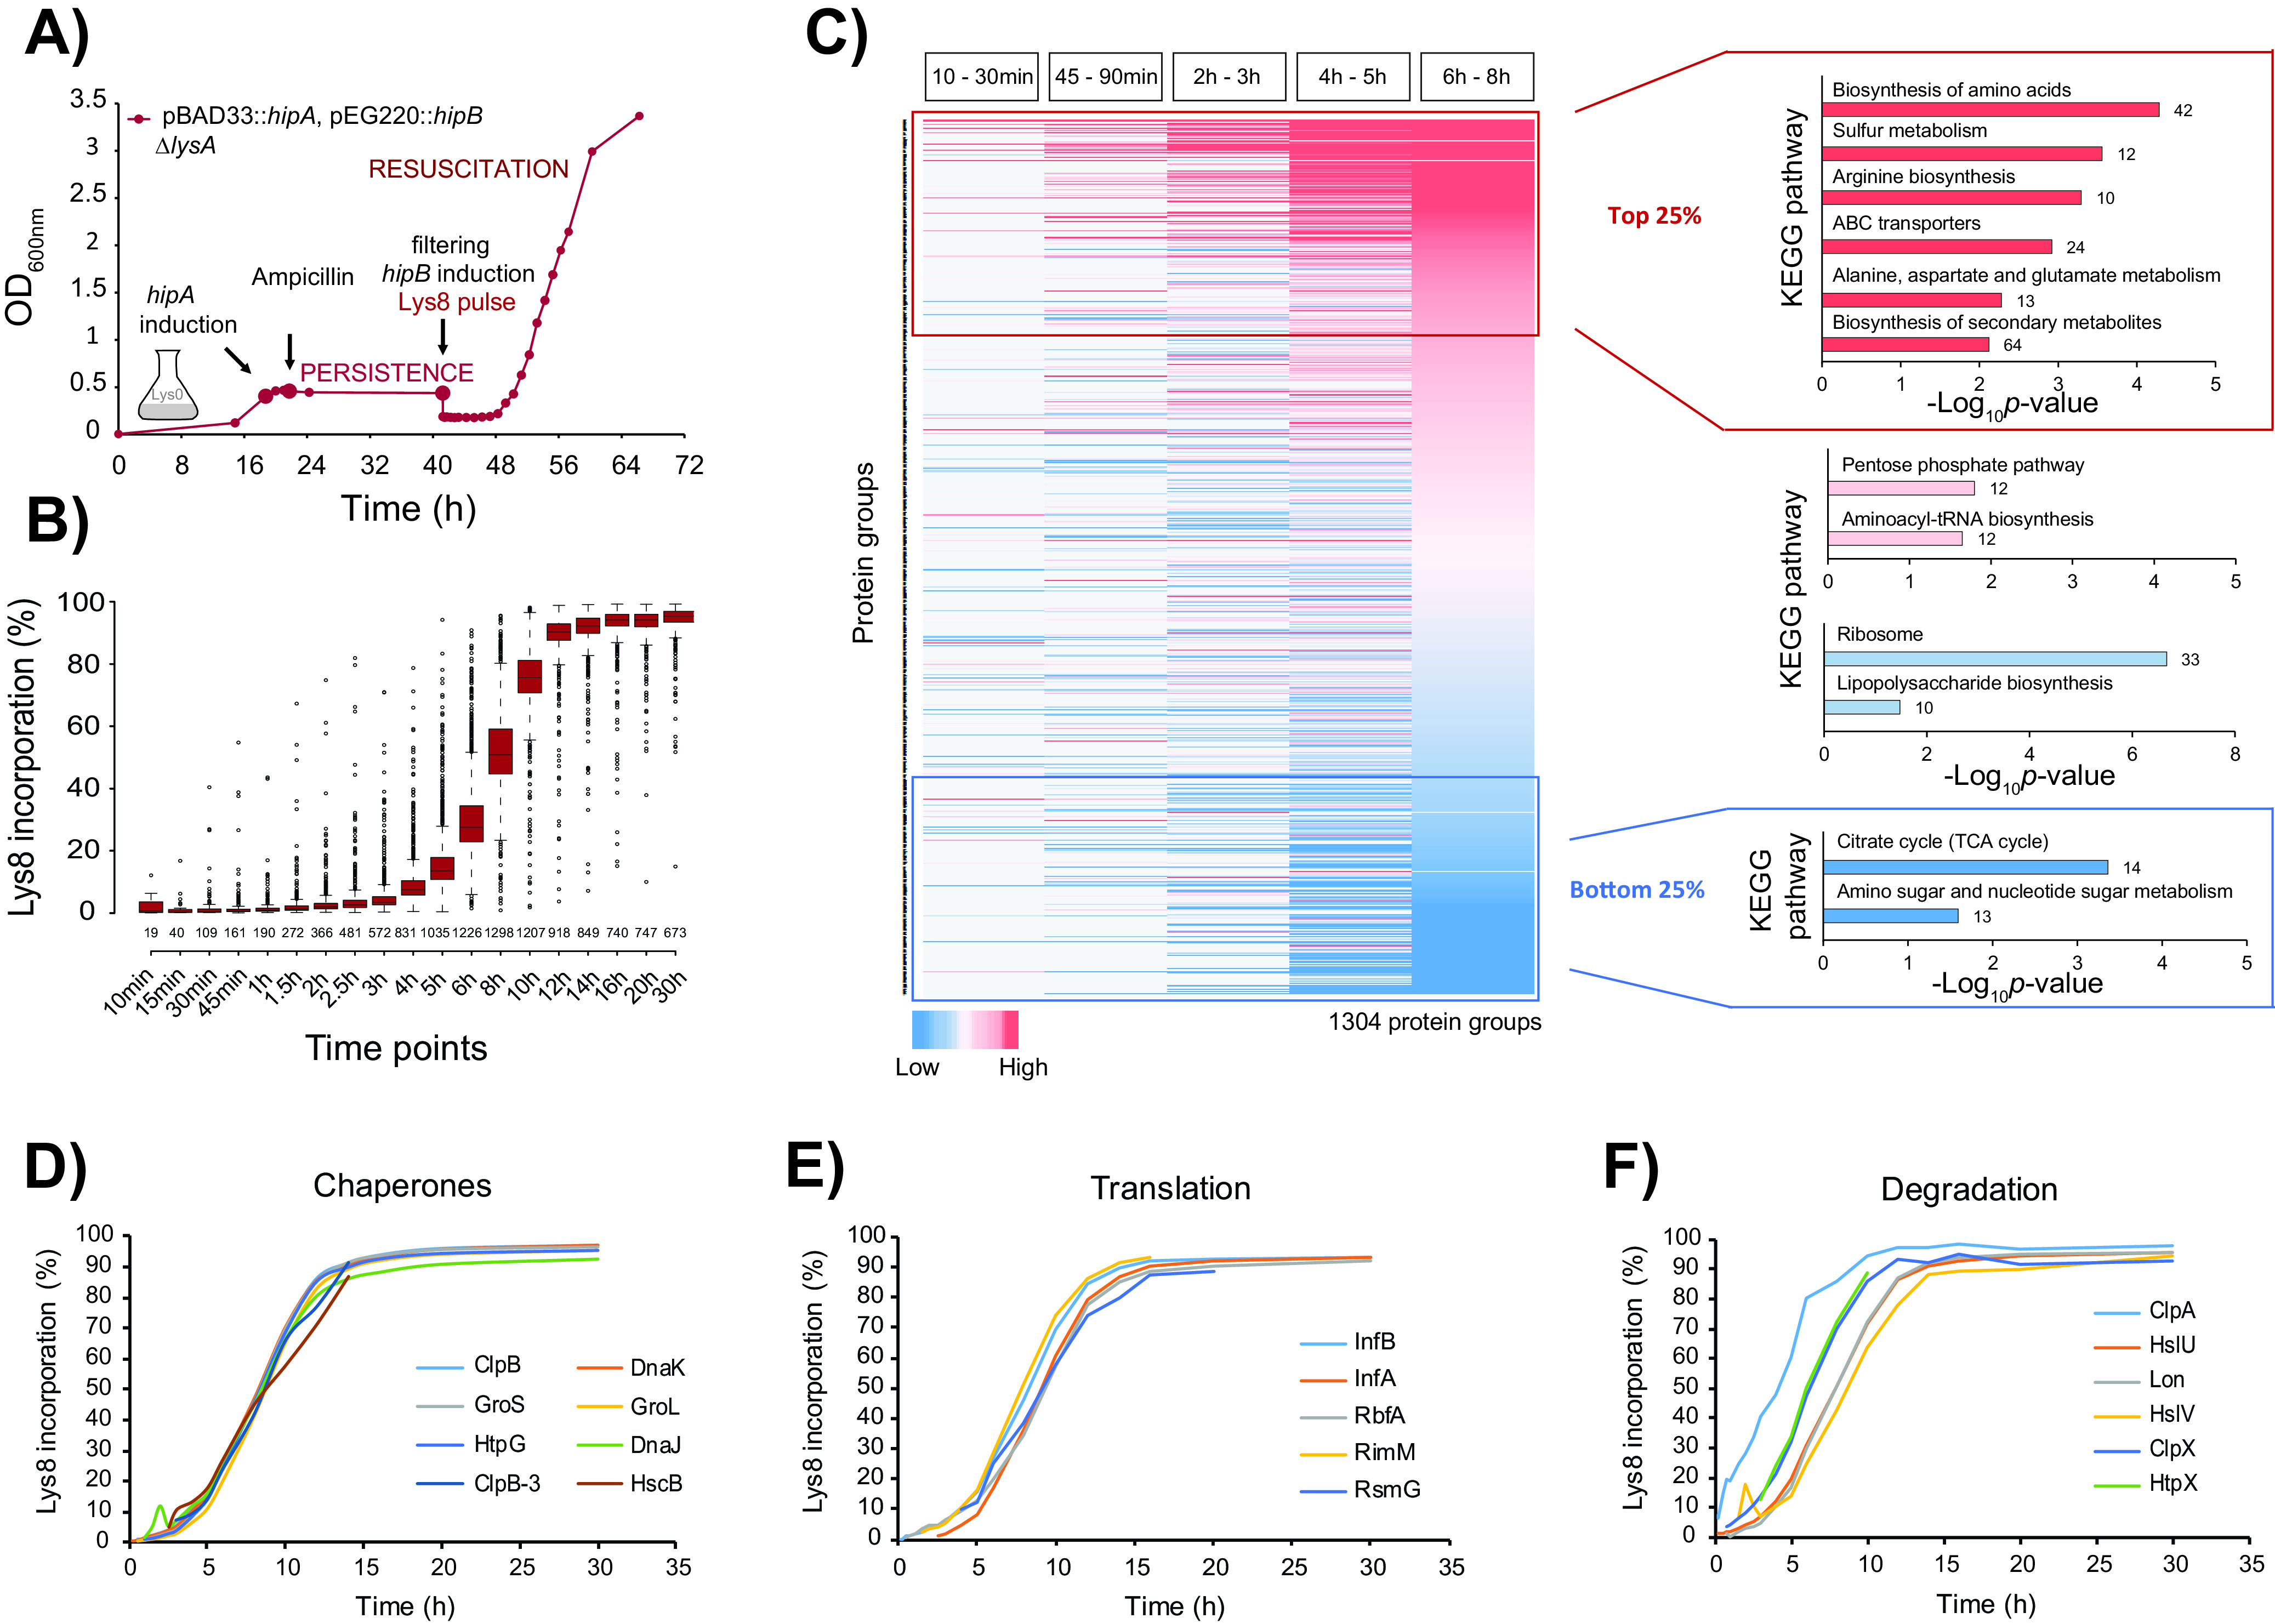
FIG 3.

Resuscitating cells restore metabolic activity and translation machinery. (A) Transcription of hipA was induced and repressed as described in the legend to Fig. 1. To trigger resuscitation, a culture sample was filtered, and cells were transferred into fresh medium containing IPTG to induce expression of hipB (plac::hipB) and “heavy” lysine (Lys8) for pulse-labeling. Cells were harvested at 21 time points thereafter. The growth curve is representative of three biological replicates. (B) Incorporation of Lys8 into proteins across 19 time points calculated from the measured protein H/L ratios. The box plots are representative of three biological replicates. (C) Heat map of all quantified proteins color coded based on their H/L ratio ranking within each time bin. Missing values are colored in gray. KEGG enrichment analysis of proteins in the 25th percentile (top 25% [red]), 25th to 50th percentile (pink), 50th to 75th percentile (light red and light blue), and 75th percentile (bottom 25% [blue]) across all time bins was performed with DAVID software against the background of all quantified proteins. The number of enriched proteins in each category is indicated outside the bars. TCA, tricarboxylic acid. (D to F) Label incorporation curves of selected examples of enzymes involved in protein and folding (chaperones), translation, and degradation.
