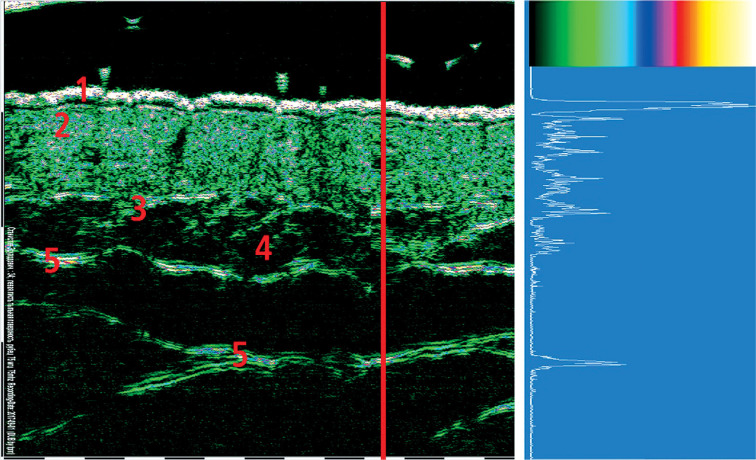
Fig. 2.
Two-dimensional 75 MHz HFUS scan and one-dimensional A-scan. Red vertical line corresponds to the direction of penetration and the reflection of ultrasonic wave. 1. Epidermis, 2. Dermis, 3. Lower dermis, with border between dermis and subcutaneous fat, 4. Subcutaneous fat, 5. Superficial fascia

