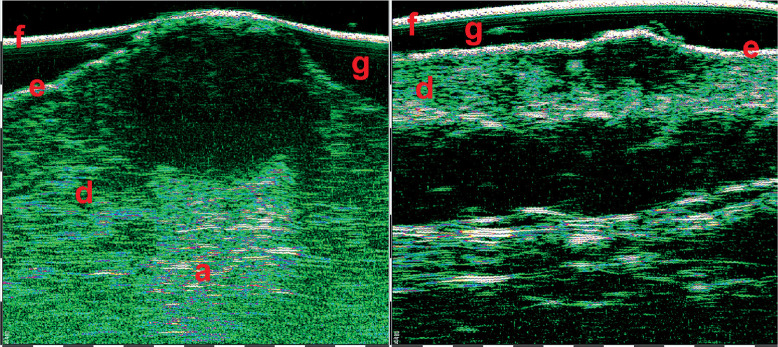
Fig. 8.
Nodular basal cell carcinomas (BCCs) 33 MHz HFUS scans. The hypo- and anechoic zones of oval shape, with some hyper-echoic points (on the right scan) visible within the structure. f – foil on the probe tip, g – gel, e – epidermis, d – dermis. Nodular BCCs have much bigger size and depth, therefore 33 MHz range was used for visualization

