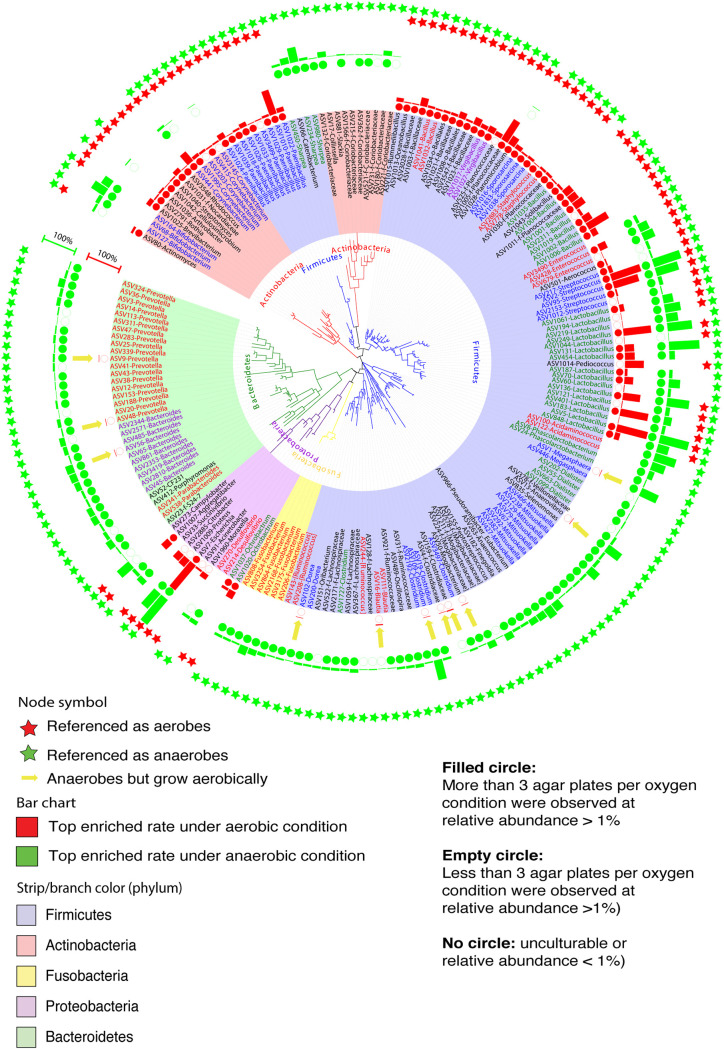
FIG 4.
Phylogenetic tree analysis showing the top 200 bacterial ASVs detected on agar plates under both aerobic and anaerobic conditions. The rings of bar charts indicate the relative abundance from the best culture conditions under aerobic (red bar) or anaerobic (green bar) conditions. The rings of circles showing the degree of culturability (filled circles, more than three agar plates per oxygen condition were observed at relative abundance of >1%; empty circles, fewer than three agar plates per oxygen condition were observed at relative abundance of >1%; no circles, yet to be cultured or relative abundance of <1%). Rings of stars showing traditional classification of these ASVs as aerobes (red) or anaerobes (green). The innermost clades and labels were colored by phyla.

