
Figure 3.
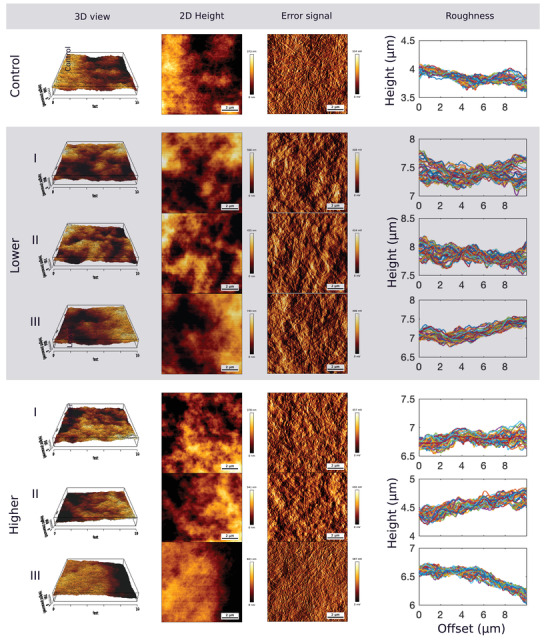
AFM topography images (10 × 10 µm, 1024 × 1024 pixels) of RAFT‐stabilized collagen gels for the Control gel, and the three segments (I–II–III) of the Lower and Higher gels. The first two columns show the 3D and 2D view of the relative value of the height of the gels (scale bar in nm). The third column is the error signal (mV) indicating the surface of the collagen gels where the banding pattern of collagen type I fibrils is visible. The surface roughness of the gels is indicated by the height profiles in the last column.