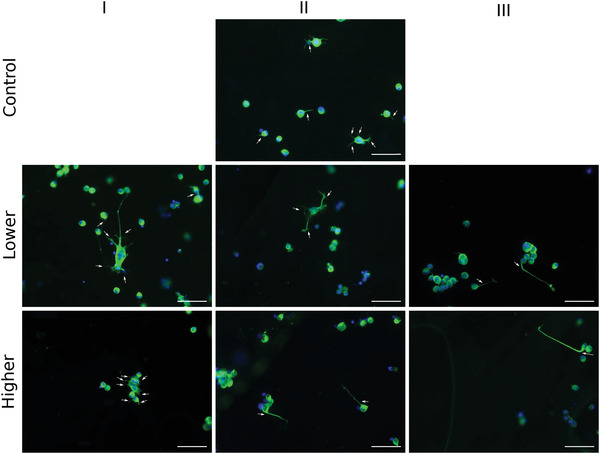
Figure 5.

Quantification of neurite response to gradient gels. NG108‐15 cells were cultured on two different gradient slopes (Lower and Higher) and on Control gel for 48 h. a) Fluorescence micrographs show sprouting of neurites; red dashed line indicates neurite length, branching spots are indicated by red arrows, and neurite orientation was measured as indicated by the white line. The white arrow indicates the direction of the gradient. Schematic indicates the classification of neurite orientation: neurites were considered as growing up the gradient for angles between −60° and 60° (yellow), down the gradient for the angles between −120° and 120° (blue), and perpendicular to the gradient otherwise (gray). Measurements were performed for each gradient segment (I–II–III) of three separate gels, for each condition (N = 3, n = 3). b) Percentage of elongation toward a given direction for each segment of the Control and gradient gels. c) Mean number of neurites per cell, d) mean neurite growth rate (µm h−1), e) percentage of NG108‐15 cells presenting neurites, and f) mean neurite length (µm) do not vary according to the presence of a gradient or differences in absolute stiffness value. However, g) the extent of neurite branching (%) is affected by the stiffness gradient. Data are shown for the different segments (I–II–III) of each gradient type (Lower and Higher) and the Control. Results are shown as mean ± SD (one‐way ANOVA test and Tukey–Kramer Multiple's comparison's test, *P < 0.05).
