FIG 2.

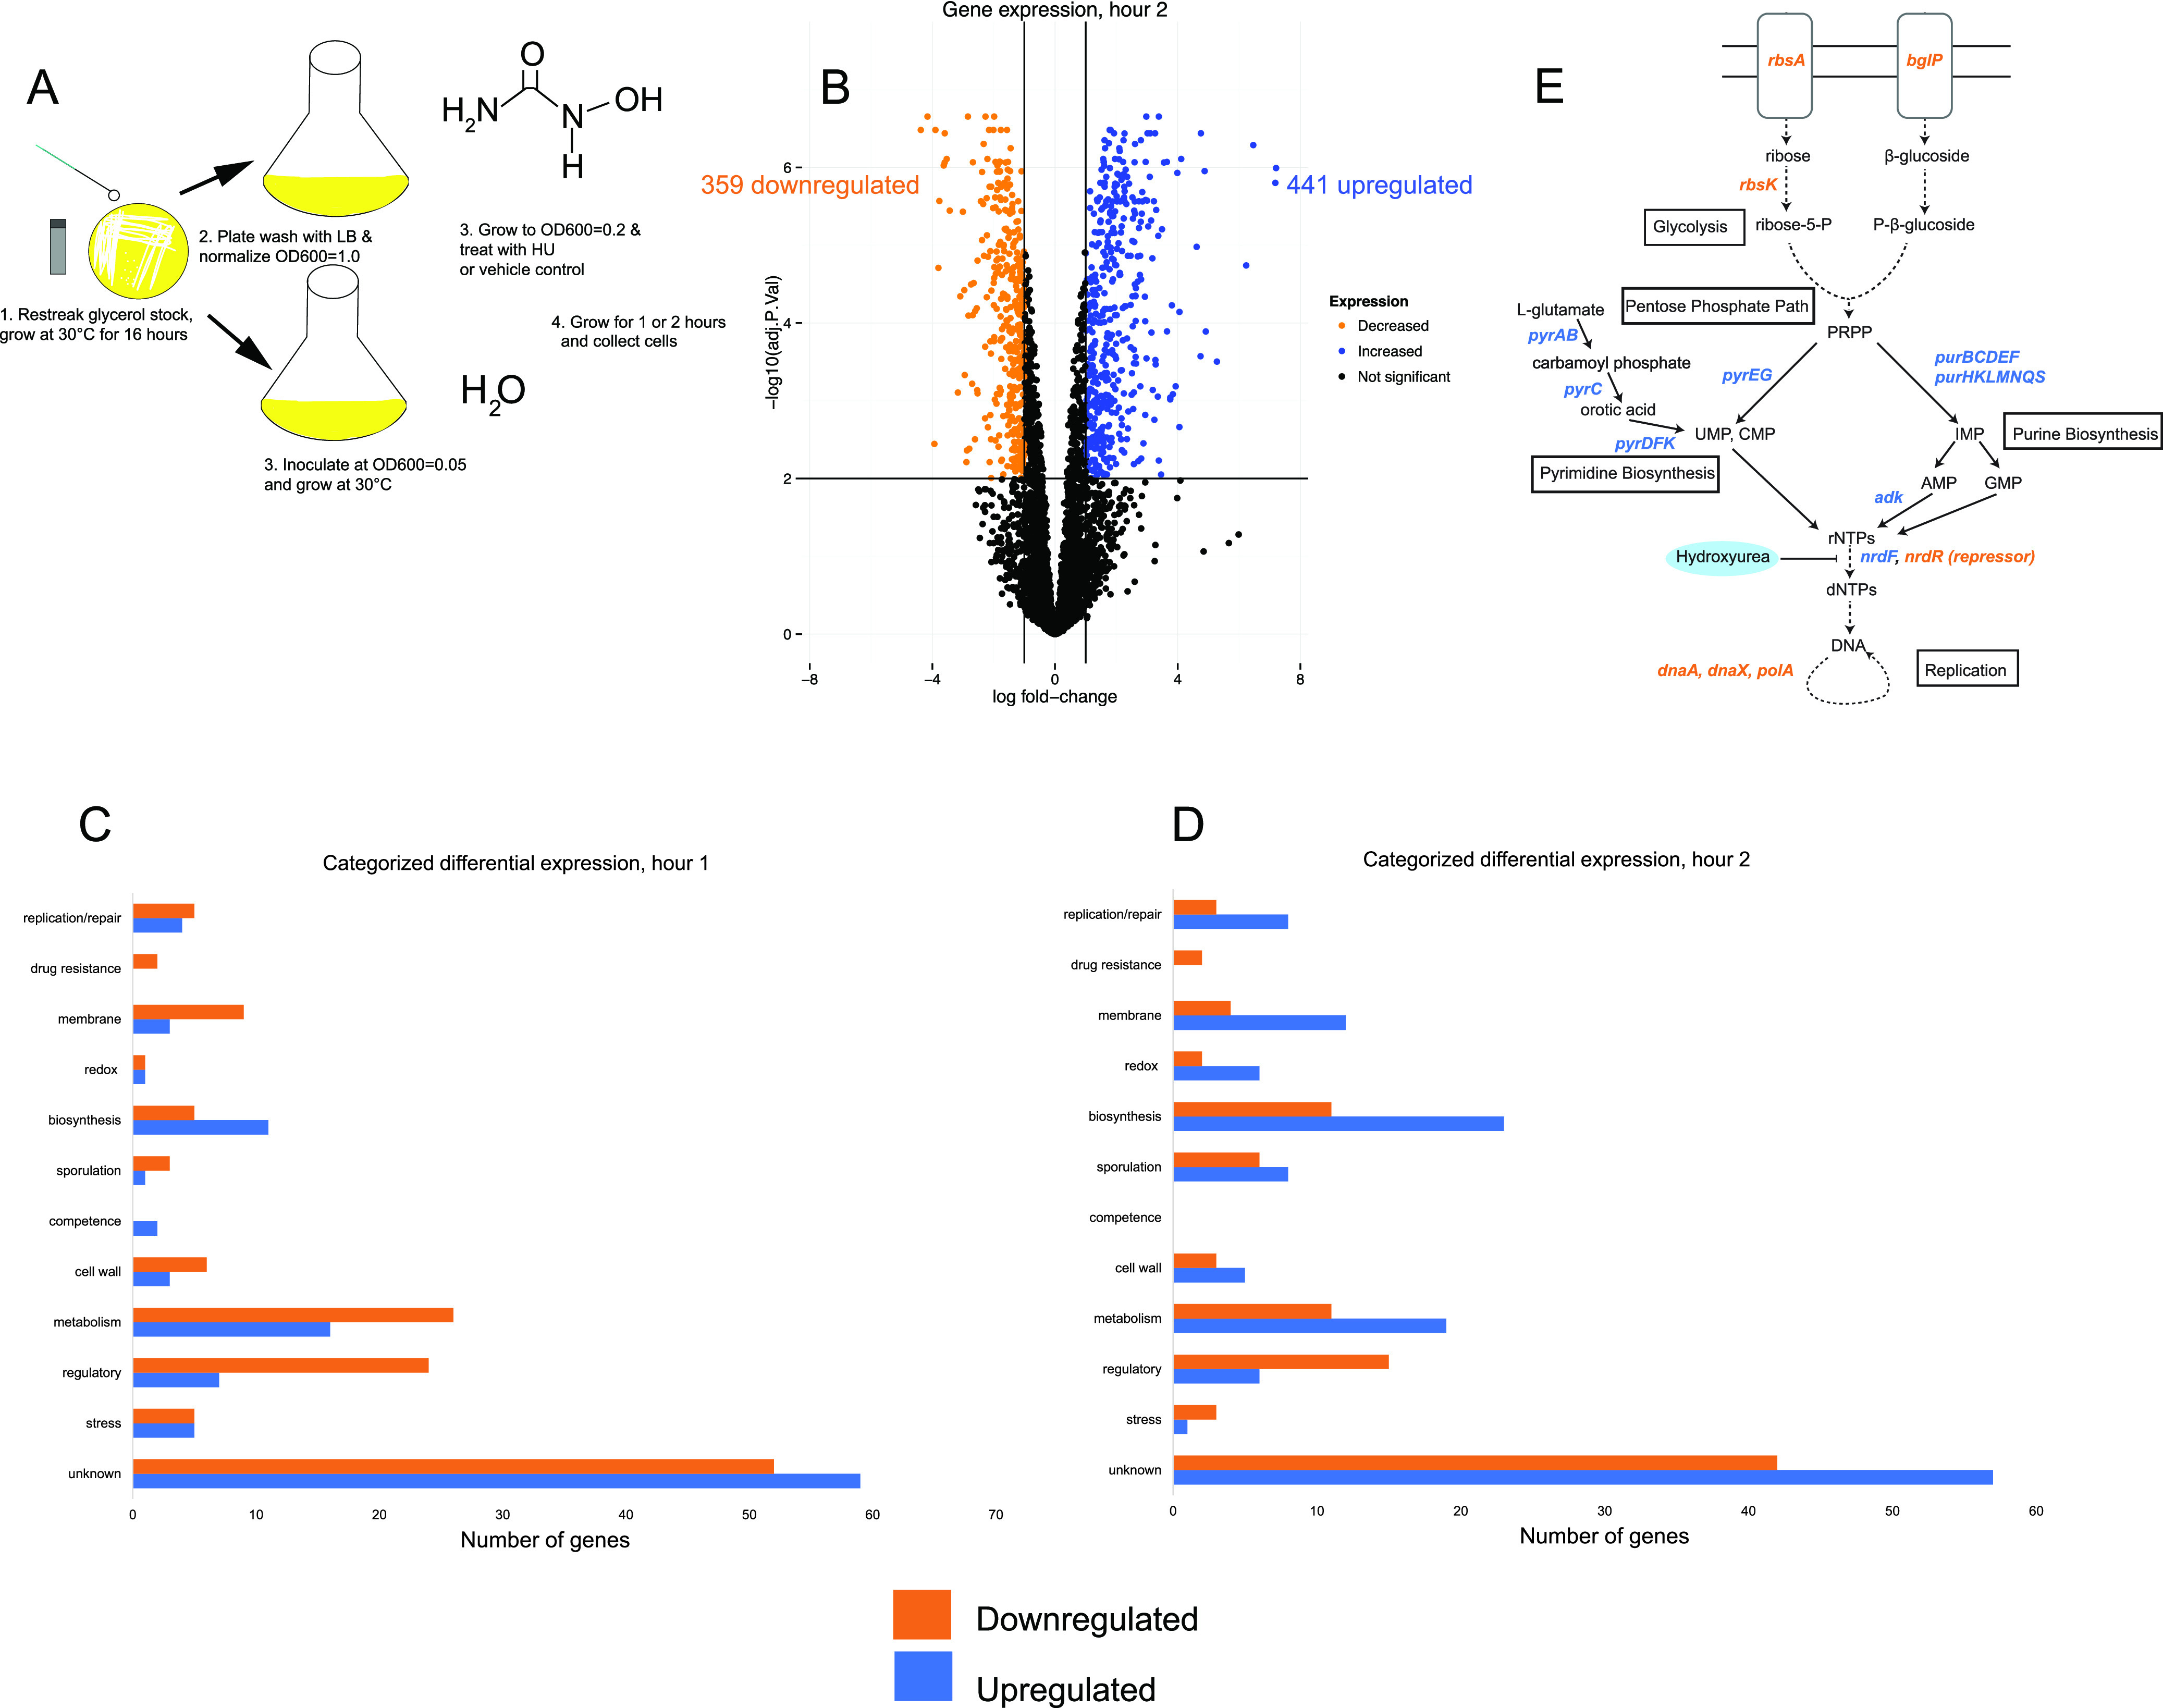
B. subtilis mounts a metabolic response to mitigate the effects of HU before inducing SOS. (A) Experimental scheme of cell growth for RNA-seq. (B) Volcano plot showing differentially expressed genes after 2 h of HU challenge. (C and D) The top 250 differentially expressed genes after 1 h (C) or 2 h (D) of HU treatment, categorized according to Gene Ontology terms. (E) Pathway schematic showing upregulated (blue) and downregulated (orange) genes.
