FIG 4.
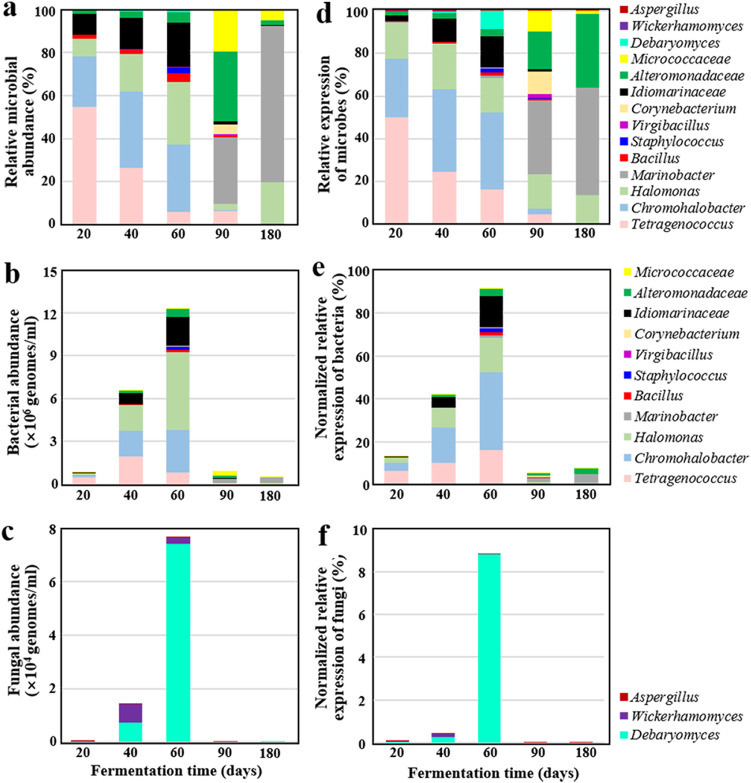
Metagenomic abundances (a, b, and c) and metatranscriptomic expressions (d, e, and f) of microbes in the ganjang solution during fermentation. The relative microbial abundances (a) and transcriptional expressions (d) were calculated based on the numbers of metagenomic sequencing and metatranscriptional mRNA reads mapped to the 17 representative genomes, respectively; the relative microbial abundances were normalized based on their genome sizes. Bacterial (b) and fungal (c) abundances were calculated by multiplying the relative microbial abundances shown in panel a by the mean values of their gene copies, shown in Fig. S1b in the supplemental material, and then dividing by the copy numbers of the 16S rRNA or ITS genes in each genome. The expressions of bacteria (e) and fungi (f) were normalized based on the sequenced read numbers of spike-in RNA in each sample and indicated in a relative manner based on the total expression of the bacteria and fungi at 60 days.

