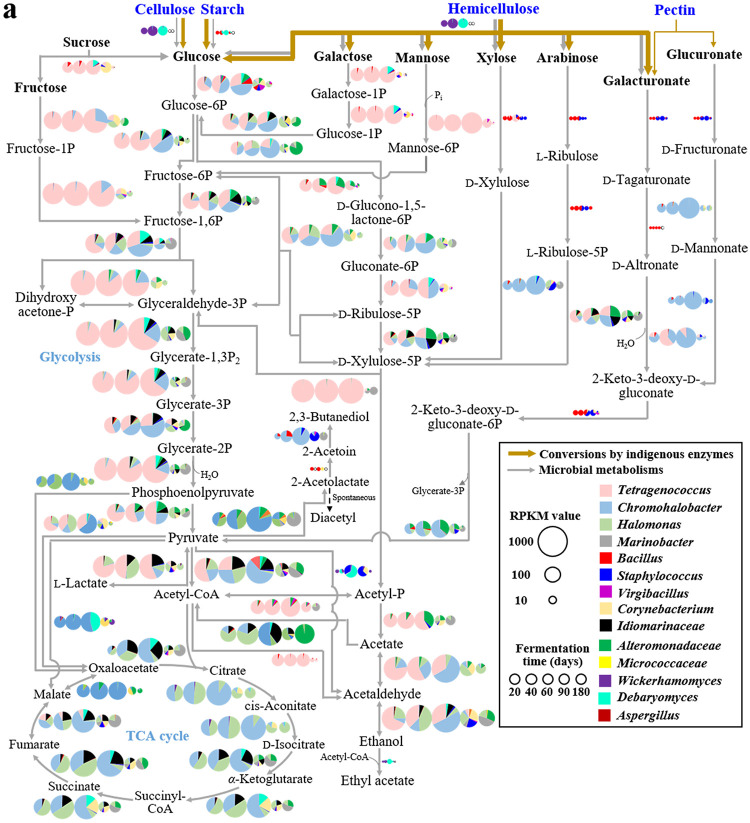
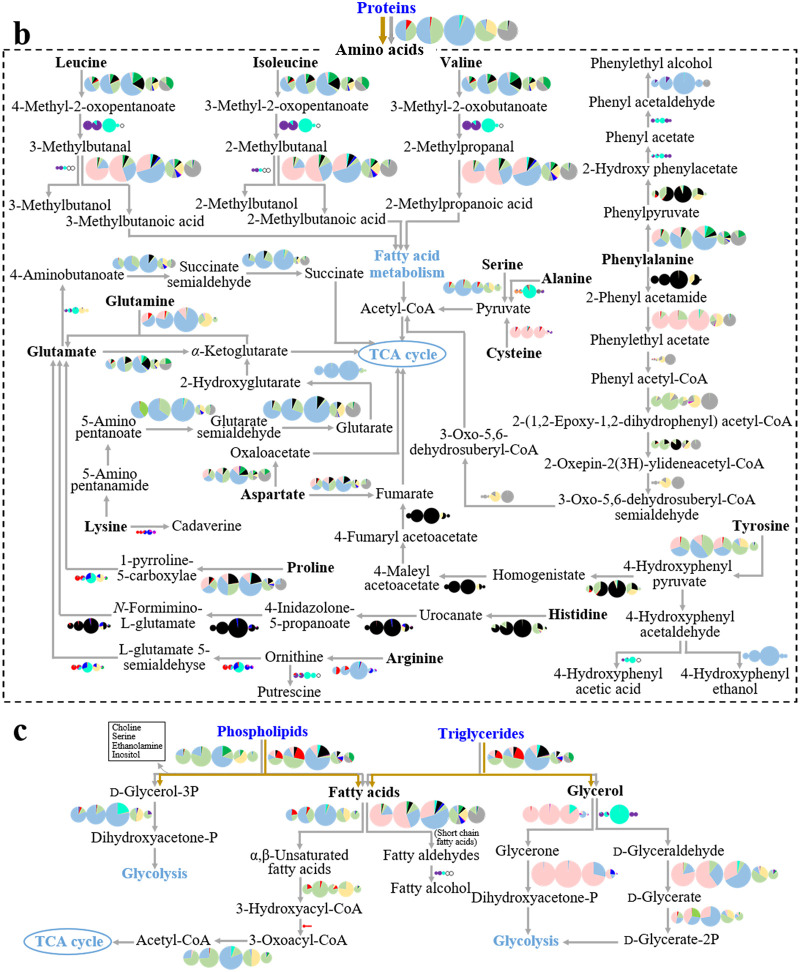
FIG 5.
Proposed metabolic pathways of the ganjang microbiome for carbohydrates (a), amino acids (b), and lipids (c) and their transcriptional expression during fermentation (20, 40, 60, 90, and 180 days). The degradation of polysaccharides (a), proteins (b), and lipids (c) by indigenous enzymes is arbitrarily depicted using lines of different thicknesses based on their contributions, shown in Fig. 1. Transcriptional levels of the ganjang microbiota are visualized using pie charts based on the normalized read numbers per kilobase of each coding sequence per million mapped reads (RPKM) values of the functional genes in each ganjang microbe. The detailed names and expressional levels of the metabolic genes are described in Table S1 in the supplemental material.


