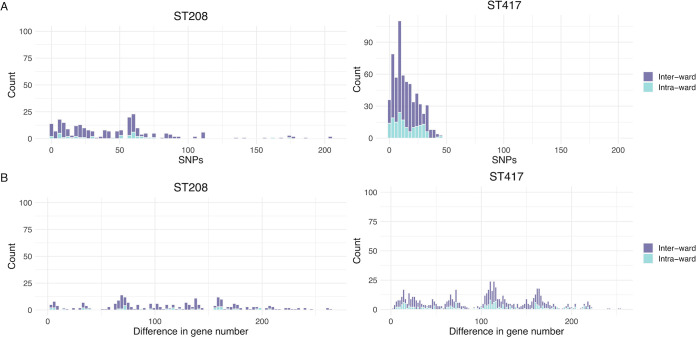
FIG 5.
Between- and within-ward transmission analysis. We conducted pairwise comparisons for the isolates of ST208 (left-hand side) and ST417 (right-hand side), which were the most abundant STs. Comparisons considering isolates from the same ward are shown in cyan (light blue) bars, whereas comparison of isolates from different wards are the purple bars. The top panels give the differences in terms of core SNPs, whereas the bottom panels show the differences in gene content.

