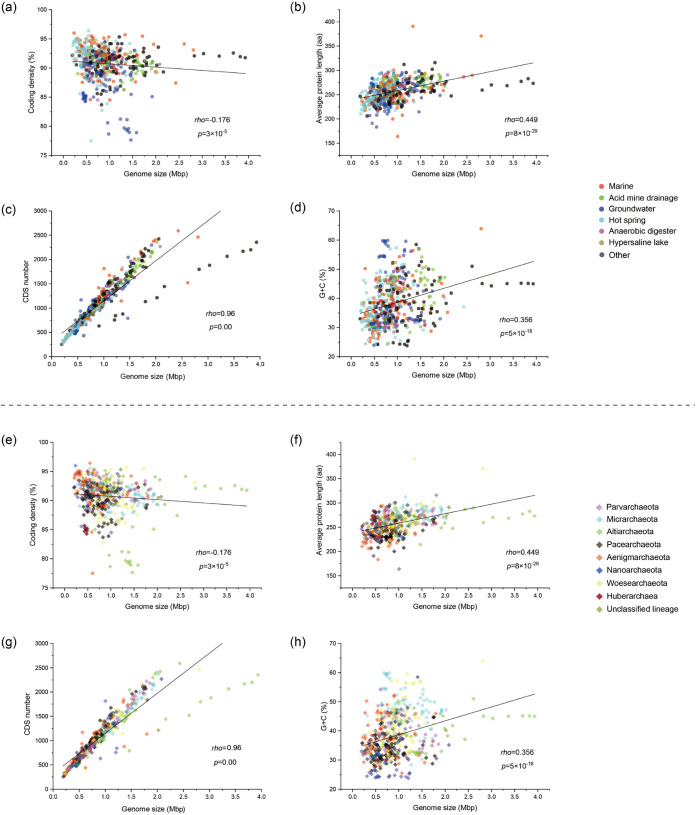
FIG 1.
Spearman rank correlation between the genome size and number of CDS, G+C content, and average protein length and coding density, colored according to habitat (top) and taxonomy (bottom) and calculated with OriginPro 2020b. Spearman ρ and the associated P value are shown for each scatterplot (a P value of ≤0.05 was considered significant).

