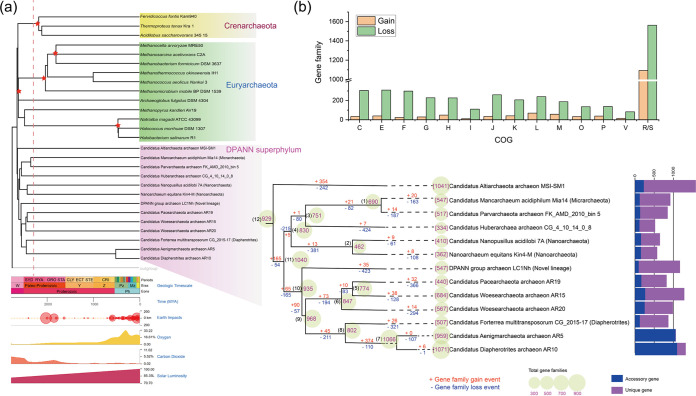
FIG 3.
(a) Evolutionary timeline of the DPANN archaea (left) predicted with the RelTime method in MEGA X. Data of asteroid impacts, solar luminosity, and fluctuations of atmospheric oxygen and carbon dioxide amount are displayed synchronously with divergence times in the form of time panels. The estimated occurrence time of the Great Oxidation Event (GOE) (∼2,400 Mya) is marked with a red dotted line. Nodes applying corrections provided by Timetree (http://www.timetree.org) are indicated with a red star. Ancestral genome content reconstruction of DPANN archaea (right) was performed with Dollo parsimony algorithms implemented in the COUNT program. The numbers of gene families of each genome are shown before the names of organisms. The numbers of gene families of the reconstructed respective most recent common ancestor (MRCA) are shown on the nodes. The numbers of gain and loss events are marked on each lineage of the tree. Plus signs indicate gain events, and minus signs indicate loss events. The stacked-bar diagram (right) shows sizes of genes shared by partial genomes (i.e., the accessory genome) and numbers of strain-specific genes (i.e., unique genes). (b) Functional proportions of DPANN gene families undergoing gain and loss events based on COG categories. Detailed description for the COG categories is provided in Data S1 at https://doi.org/10.6084/m9.figshare.14806173.v1.

